Top 15 stories (last 10 days) on the issuers on this page or Asia credit generally (SoftBank, Alibaba, Tencent, China property, Petronas, Adani, …). Note: on this page MSCI means MSCI’s Indonesia equity-index review / possible downgrade–deletion risk (spillover into IDR and Indonesian corporate USD credit) — not SoftBank/BNI. Sources: DebtWire (free/public headlines only — no sub), HKEX (filings / listedco announcements), Bloomberg, FT, Nikkei Asia, WSJ, S&P Global Ratings, Moody’s, Gavekal (public research teasers only), Coatue (public Perspectives blog only), plus X as secondary fill only (high-engagement; ≤2; prefer HKEX/press on same event). One story per topic (prefer HKEX over secondary press on the same event); ranked by importance / impact / viewers-proxy; remaining slots filled round-robin across primary sources. Agency sites prefer rating actions / outlook / CreditWatch.
- SoftBank-Backed OPay Halts IPO to Respond to Regulatory Inquiry · BBG/Reuters · 2026-10-31
- Asian Private-Equity Firm to Buy Beleaguered China Evergrande’s Property-Management Arm · Reuters/WSJ · 2026-10-30
- SoftBank’s Son Plans $50 Billion Malaysia Tech Outlay, PM Says · BBG/Nikkei · 2026-10-25
- Private equity firm swoops on China Evergrande unit in rare win for creditors · FT · 2026-10-30
- PAG to buy 51% of China Evergrande services arm for $510m · Nikkei · 2026-10-30
- MDEVY | Melco International Development Ltd. ADR Company Profile & Executives · WSJ · 2026-10-29
- Evergrande liquidators strike US$513 million deal to sell property services arm - South China Morning Post · SCMP · 2026-10-30
- Research Update: Korea-U.S. Strategic Investment | S&P Global Ratings · S&P · 2026-10-26
- Moody's Ratings affirms Freeport Indonesia's Baa3 ratings · Moody's · 2026-10-28
- TotalEnergies Strengthens Cooperation with PETRONAS SONANGOL and OIL INDIA LIMITED to Reduce Methane Emissions – Company Announcement - FT.com · FT · 2026-11-01
- Apple to launch iPhone AI features in China in December via Alibaba partnership - South China Morning Post · SCMP · 2026-10-31
- PRIVATE CREDIT DEFAULTS JUST HIT A RECORD — Fitch says private credit defaults have reached an all-time high, with lenders increasingly relying on accounting gymnastics and debt extensions to keep troubled borrowers afloat. · X · 2026-10-31
- China’s high-yield dollar bonds are heading for their worst week in more than a year as signs of liquidity strains at state-owned conglomerate Zhuhai Huafa Group sapped sentiment. · X · 2026-10-30
- MSCI Indonesia deletion overhang: Indonesian corporate USD bond sale shelved · Bloomberg · 2026-10-27
- Breakingviews - COMMENTARY: PAG's China property deal blueprint comes together · Reuters · 2026-11-02
10-day window · issuer keywords OR general Asia credit · one story/topic · importance/impact/viewers-proxy rank · round-robin DebtWire→HKEX→Bloomberg→FT→Nikkei→WSJ→S&P→Moody’s→Gavekal→Coatue · X secondary fill only (≤2; high-follower / high-engagement; prefer HKEX/press on same event) · prefer HKEX filings over press on same event · DebtWire via public Google News index only (no subscription scrape); HKEX via public Google News index (hkexnews.hk); Gavekal public research.gavekal.com teasers only; Coatue public coatue.com/blog only; S&P / Moody’s via Google News + signed-in sessions when available (rating actions preferred).
Ask Gemini opens Google AI Mode (Gemini) with your question prefilled — native gemini.google.com has no reliable ?q= deep link. Open Gemini app copies the question and opens the Gemini chat UI for paste. Bond filters below stay separate.
“What's going on with New World Development both seniors and perps?”
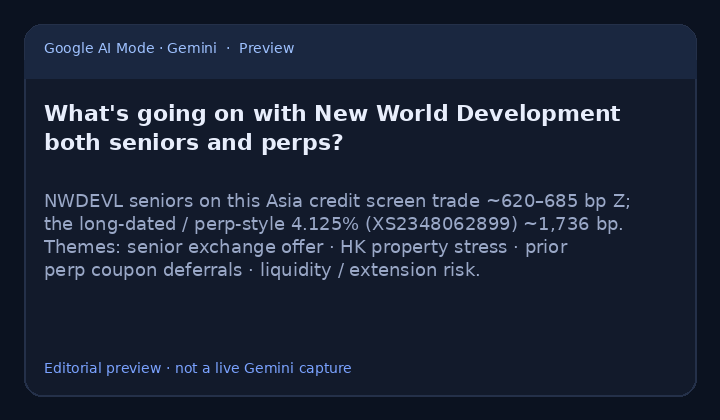
On this Asia credit screen (as of 16 Oct 2026), New World (NWDEVL) seniors sit among the wider HK property credits: 4.125% Jul-29 ~661 bp Z / YTM ~10.7%, 4.75% Jan-27 ~638 bp, 8.625% Feb-28 ~685 bp, 4.5% May-30 ~619 bp. The long-dated / perp-style BVI 4.125% (XS2348062899) is much wider still — Z ~1,736 bp, YTC ~21%, ETF PX ~79. Shared drivers in recent coverage: the Oct 2026 senior exchange into new VD secured 2032 notes (final expiry ~20 Oct London), prior May 2026 perpetual coupon deferrals, HK property / liquidity stress, and the 11 SKIES early termination / loss provision overhang. Note: the 4.8% NWD perp (XS2268392599) is held elsewhere and is not in the 3411/09P ETF universe on this page.
Preview · themes from recent coverage (not a live Gemini capture)
Themes drawn from HKEX / NWD IR filings (senior exchange 6 & 15 Oct 2026; perp deferral May 2026; 11 SKIES Sep 2026), Bloomberg / Reuters / Business Times NWD coverage, and this screen’s Z-spread / YTM / YTC marks (US Treasury CMT curve · as of 16 Oct 2026).
“Show how steep the SoftBank senior curve is for all SoftBank senior bonds in a chart, and overlay SoftBank Sub/hybrid (and perp) Z-spreads on the right vertical axis.”
As of 30 Oct 2026 · 14 Senior · 3 Sub (hybrids + perp) with Z · X = years to maturity (Senior) / years to call (Sub) · ETF marks, US Treasury CMT curve · soft-fail if Z missing
On this Asia credit screen (as of 30 Oct 2026), SoftBank’s USD senior curve is steep: 14 seniors with Z marks span ~236 bp (tightest 5.13% 2027-09, ~0.9y) to ~486 bp (widest 9.75% 2034-04, ~7.4y). Front ~0.9–1.7y avg Z ~258 bp vs back ~7.4–9.5y avg Z ~427 bp (~169 bp steeper). Right axis overlays 3 SoftBank Sub points (dated hybrids + perp) at years-to-call: 6.88% perp call 2027-07 ~639 bp; 7.63% hybrid call 2031-04 ~309 bp; 8.25% hybrid call 2035-10 ~389 bp. Hybrids can look “tight” vs long seniors on raw Z because they price to the call window, not legal maturity — that is subordination + extension risk, not a flatter senior book.
SoftBank Senior / Sub Z from this screen’s ETF marks (US Treasury CMT curve · as of 30 Oct 2026). Sub X uses years to call; Senior X uses years to maturity. Chart is editorial preview, not a live Gemini capture.
“What is going on with SoftBank over the past 2 years? And should I buy perps or seniors if I should buy in the first place?”
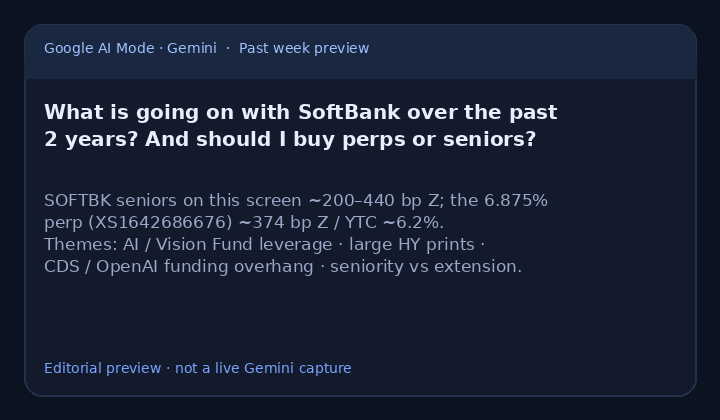
On this Asia credit screen (as of 16 Oct 2026), SoftBank (SOFTBK) is a large HY sleeve: seniors span roughly ~200–440 bp Z (near-dated 5.125%/6.25% mid-200s; longer 9.25%/9.75% 2032–34 toward ~400–440 bp), while the 6.875% USD perp (XS1642686676, call ~Jul-27) trades ~374 bp Z / YTC ~6.2% near par. Shared themes over ~2 years: Vision Fund / AI bet leverage and equity NAV swings; repeated large USD HY issuance (incl. ~US$11bn OpenAI-linked print colour in Sep 2026); mid-Oct 2026 AI-debt scare (5y CDS cited ~424 bp) alongside acquisition chatter (e.g. Allied Universal). If buying at all, seniors are the simpler credit claim (known maturity, no coupon deferral / extension stack); the perp pays a subordination / non-call premium and sits below seniors in the capital structure — sizing and call/extension risk matter more than the headline YTC.
Preview · themes from recent coverage (not a live Gemini capture)
Themes drawn from Reuters / Bloomberg / Business Times SoftBank & AI-credit coverage (2024–2026), Moody’s periodic review colour, and this screen’s SOFTBK Z-spread / YTM / YTC marks (US Treasury CMT curve · as of 16 Oct 2026).
| Type | Ticker | Name | Country | Sen/Sub | Coupon | Dur | Maturity | Call | YTM | YTC | Z-S | RatingS&P/Moody’s/Fitch | PX from ETF | SPM PX | Issue size | Issue date | ISIN | Def | Dm |
|---|---|---|---|---|---|---|---|---|---|---|---|---|---|---|---|---|---|---|---|
| Sov/Quasi121 | Sen/Sub | Coupon | Dur | Maturity | Call | YTM | YTC | Z-S | RatingS&P/Moody’s/Fitch | PX from ETF | SPM PX | Total issue106.6bn | Issue date | ISIN | Def | Dm | |||
| Quasi-Sov56 | |||||||||||||||||||
| IG | PLNIJ | 4 3/8 02/05/50 | Sov/Quasi | Senior | 4.375% | 12.46 | 2050-02-05 | — | 7.26% | — | 195bp | BBB/Baa2/BBB | 67.68 | 67.46 | 500mm | 2019-11-04 | US71568QAM96 | N | — |
| IG | CHPWCN | 4 1/4 PERP | Sov/Quasi | Sub | 4.25% | 0.49 | PERP | 2026-12-13 | — | 4.70% | 1520bp | Baa2/BBB | 99.78 | 100.08 | 500mm | 2022-04-14 | XS2455411558 | N | — |
| Sovereign65 | |||||||||||||||||||
| HY | PKSTAN | Pakistan Sukuk | Sov/Quasi | Senior | 7.95% | 2.02 | 2029-01-31 | — | 7.07% | — | 315bp | B/B3/B- | 101.99 | — | 1.0bn | 2022-01-31 | XS2419405274 | N | — |
| HY | PKSTAN | Pakistan | Sov/Quasi | Senior | 6.97% | 2.27 | 2029-04-24 | — | 7.65% | — | 300bp | B/B3/B- | 98.47 | — | 750mm | 2026-04-24 | XS3353874145 | N | — |
| HY | PKSTAN | Pakistan | Sov/Quasi | Senior | 7.38% | 3.75 | 2031-04-08 | — | 8.34% | — | 366bp | B/B3/B- | 96.46 | — | 1.8bn | 2021-04-08 | XS2322319638 | N | — |
| HY | PKSTAN | Pakistan | Sov/Quasi | Senior | 7.5% | 4.34 | 2032-03-10 | — | 8.16% | — | 355bp | B/B3/B- | 97.14 | — | 1.8bn | 2026-09-10 | XS3497415557 | N | — |
| HY | PKSTAN | Pakistan | Sov/Quasi | Senior | 7.9% | 6.63 | 2036-09-10 | — | 9.03% | — | 413bp | B/B3/B- | 92.63 | — | 1.3bn | 2026-09-10 | XS3489966229 | N | — |
| HY | PKSTAN | Pakistan | Sov/Quasi | Senior | 8.88% | 9.35 | 2051-04-08 | — | 9.69% | — | 434bp | B/B3/B- | 92.50 | — | 1.1bn | 2021-04-08 | XS2322321964 | N | — |
| China69 | Sen/Sub | Coupon | Dur | Maturity | Call | YTM | YTC | Z-S | RatingS&P/Moody’s/Fitch | PX from ETF | SPM PX | Total issue42.0bn | Issue date | ISIN | Def | Dm | |||
| Building Materials1 | |||||||||||||||||||
| HY | WESCHI | West China Cement | China | Senior | 9.9% | 1.81 | 2028-12-04 | — | 15.07% | — | 1278bp | B/B | 89.56 | 90.33 | 400mm | 2025-12-04 | XS3219577148 | N | — |
| Financial24 | |||||||||||||||||||
| IG | CTIH | 6.4 PERP | China | Sub | 6.4% | 1.42 | PERP | 2028-03-09 | — | 5.48% | 156bp | BBB+/A- | 101.31 | 100.12 | 2.0bn | — | XS2588464433 | N | — |
| Financial Other1 | |||||||||||||||||||
| HY | ZHPRHK | Zhenro | China | Senior | 0% | 0.00 | 2026-01-07 | — | — | — | — | N.R/W.R | 0.05 | 0.43 | 300mm | 2021-01-07 | XS2279711779 | Y | — |
| Industrial2 | |||||||||||||||||||
| Industrial Other3 | |||||||||||||||||||
| HY | FOSUNI | Fortune Star | China | Senior | 6.8% | 2.56 | 2029-09-09 | — | 8.25% | — | 389bp | BB-/N.R | 96.21 | 96.79 | 400mm | 2025-09-09 | XS3175828113 | N | — |
| Infrastructure1 | |||||||||||||||||||
| Local Authority5 | |||||||||||||||||||
| HY | CPDEV | Central Plaza | China | Senior | 7.15% | 1.31 | 2028-03-21 | — | 11.41% | — | 756bp | — | 94.27 | — | — | 2025-03-21 | XS2867168226 | N | — |
| HY | CPDEV | Central Plaza | China | Senior | 6.8% | 2.22 | 2029-04-07 | — | 11.05% | — | 647bp | N.R/BB+ | 90.93 | 100.06 | 250mm | 2025-04-07 | XS3035206518 | N | — |
| Oil & Gas3 | |||||||||||||||||||
| Other11 | |||||||||||||||||||
| HY | FUTLAN | Seazen | China | Senior | 11.88% | 0.61 | 2027-06-26 | — | 13.43% | — | 1562bp | B-/N.R | 98.59 | 98.89 | 350mm | 2025-06-26 | XS3099012406 | N | — |
| HY | VNKRLE | Vanke HK | China | Senior | 3.98% | 0.96 | 2027-11-09 | — | 50.23% | — | — | CCC-/C/C | 54.94 | 54.95 | 1.0bn | 2017-11-09 | XS1713193586 | N | — |
| HY | LNGFOR | Longfor | China | Senior | 4.5% | 1.16 | 2028-01-16 | — | 11.23% | — | 914bp | B2/BB- | 90.94 | 93.62 | 500mm | 2018-01-16 | XS1743535491 | N | — |
| HY | DALWAN | Wanda | China | Senior | 12.75% | 1.15 | 2028-02-05 | — | 11.87% | — | 927bp | N.R | 101.17 | — | 360mm | 2026-02-05 | XS3286199461 | N | — |
| HY | GRNCH | Greentown | China | Senior | 8.45% | 1.23 | 2028-02-24 | — | 12.81% | — | 972bp | B1 | 94.21 | 99.98 | 500mm | 2025-02-24 | XS2971601336 | N | — |
| HY | SHUION | Shui On | China | Senior | 9.75% | 1.96 | 2029-01-26 | — | 11.44% | — | 786bp | N.R/N.R | 96.42 | 100.99 | 450mm | 2026-01-26 | XS3040578745 | N | — |
| HY | FTLNHD | New Metro | China | Senior | 11.8% | 2.03 | 2029-03-09 | — | 15.35% | — | 1113bp | B-/N.R | 92.86 | 94.80 | 355mm | 2026-03-09 | XS3298830434 | N | — |
| HY | ZHLGHD | Zhongliang | China | Senior | 5% | 0.50 | 2029-07-01 | — | 243.06% | — | — | N.R/N.R | 2.89 | 3.75 | 1.3bn | 2024-03-20 | XS2771889370 | Y | — |
| HY | CHJMAO | Franshion | China | Senior | 4.25% | 2.51 | 2029-07-23 | — | 8.00% | — | 404bp | Ba3 | 90.18 | 92.10 | 500mm | 2019-07-23 | XS2030348903 | N | — |
| HY | LNGFOR | Longfor | China | Senior | 3.95% | 2.65 | 2029-09-16 | — | 12.96% | — | 849bp | B+/B2/BB- | 78.17 | 84.50 | 850mm | 2019-09-16 | XS2033262895 | N | — |
| HY | SINOCE | Sino-Ocean | China | Senior | 3% | 2.81 | 2033-03-27 | — | 75.24% | — | — | N.R/N.R | 5.50 | 5.88 | 1.6bn | 2025-03-27 | XS3033830772 | N | — |
| Owned No Guarantee4 | |||||||||||||||||||
| Real Estate1 | |||||||||||||||||||
| TMT13 | |||||||||||||||||||
| Japan33 | Sen/Sub | Coupon | Dur | Maturity | Call | YTM | YTC | Z-S | RatingS&P/Moody’s/Fitch | PX from ETF | SPM PX | Total issue40.7bn | Issue date | ISIN | Def | Dm | |||
| Automotive5 | |||||||||||||||||||
| HY | NSANY | Nissan | Japan | Senior | 7.5% | 3.14 | 2030-07-17 | — | 7.13% | — | 294bp | BB-/Ba2/BB | 101.25 | 99.44 | 1.0bn | 2025-07-17 | USJ57160CX92 | N | — |
| HY | NSANY | Nissan | Japan | Senior | 4.81% | 3.46 | 2030-09-17 | — | 7.45% | — | 292bp | BB-/Ba2/BB | 91.01 | 90.14 | 2.5bn | 2020-09-17 | USJ57160DZ32 | N | — |
| HY | NSANY | Nissan | Japan | Senior | 7.75% | 4.47 | 2032-07-17 | — | 7.48% | — | 304bp | BB-/Ba2/BB | 101.28 | 99.29 | 750mm | 2025-07-17 | USJ57160CY75 | N | — |
| HY | NSANY | Nissan | Japan | Senior | 8.13% | 6.05 | 2035-07-17 | — | 7.96% | — | 328bp | BB-/Ba2/BB | 101.08 | 100.80 | 1.2bn | 2025-07-17 | USJ57160CZ41 | N | — |
| Banking6 | |||||||||||||||||||
| IG | MUFG | MUFG | Japan | Sub | 6.35% | 6.35 | PERP | 2036-01-14 | — | 6.95% | 223bp | BB+/Baa3/BB+ | 95.89 | 94.17 | 1.0bn | 2025-09-12 | US606822DP65 | N | — |
| IG | MUFG | MUFG | Japan | Sub | 8.2% | 1.95 | PERP | 2029-01-14 | — | 5.21% | 127bp | BB+/Baa3/BB+ | 106.92 | 105.00 | 750mm | 2023-10-26 | US606822DD36 | N | — |
| HY | MIZUHO | Mizuho | Japan | Sub | 7.05% | 6.72 | PERP | 2036-12-15 | — | 7.36% | 265bp | BB+/Ba1 | 97.76 | — | 1.0bn | 2026-09-14 | US60687YEA38 | N | — |
| IG | SUMIBK | SMFG | Japan | Sub | 6.6% | 5.42 | PERP | 2034-06-04 | — | 6.81% | 230bp | BB+/Baa3 | 98.75 | 95.96 | 1.0bn | 2024-03-05 | US86562MDK36 | N | — |
| IG | SUMIBK | SMFG | Japan | Sub | 6.45% | 5.90 | PERP | 2035-06-04 | — | 6.85% | 226bp | BB+/Baa3 | 97.37 | 94.23 | 1.2bn | 2025-02-25 | US86562MDW73 | N | — |
| IG | SUMIBK | SMFG | Japan | Sub | 6.95% | 6.78 | PERP | 2036-12-04 | — | 7.12% | 243bp | BB+/Baa3 | 98.74 | 97.30 | 500mm | 2026-09-10 | US86562MEY21 | N | — |
| BROKERS1 | |||||||||||||||||||
| HY | NOMURA | Nomura | Japan | Sub | 7% | 3.17 | PERP | 2030-07-14 | — | 6.81% | 262bp | Ba3/BB | 100.65 | 99.00 | 1.0bn | 2025-07-01 | US65535HCC16 | N | — |
| Retailers4 | |||||||||||||||||||
| HY | RAKUTN | Rakuten | Japan | Sub | 6.25% | 3.86 | PERP | 2031-04-21 | — | 7.93% | 319bp | B/N.R | 93.75 | 93.77 | 1.0bn | 2021-04-22 | USJ6S87BAX69 | N | — |
| HY | RAKUTN | Rakuten | Japan | Sub | 8.13% | 2.69 | PERP | 2029-12-14 | — | 6.81% | 291bp | B/N.R | 104.05 | 101.17 | 550mm | 2024-12-13 | USJ64264AM64 | N | — |
| Wireless17 | |||||||||||||||||||
| HY | SOFTBK | SoftBank | Japan | Senior | 6.25% | 1.36 | 2028-04-15 | — | 7.05% | — | 269bp | BB+/Ba2 | 98.88 | 96.69 | 1.0bn | 2018-04-03 | XS1793255198 | N | — |
| HY | SOFTBK | SoftBank | Japan | Senior | 6.5% | 2.20 | 2029-04-10 | — | 7.68% | — | 314bp | BB+/N.R | 97.37 | 98.39 | 500mm | 2025-07-10 | XS3109833817 | N | — |
| HY | SOFTBK | SoftBank | Japan | Senior | 6.75% | 2.36 | 2029-07-08 | — | 7.05% | — | 316bp | BB+/N.R | 99.20 | 98.62 | 400mm | 2024-07-08 | XS2854422578 | N | — |
| HY | SOFTBK | SoftBank | Japan | Senior | 7.63% | 2.60 | 2029-10-22 | — | 8.29% | — | 359bp | BB+/N.R | 98.28 | 100.12 | 400mm | 2026-04-22 | XS3344488948 | N | — |
| HY | SOFTBK | SoftBank | Japan | Senior | 6.88% | 3.51 | 2031-01-10 | — | 7.92% | — | 370bp | BB+/N.R | 96.14 | 95.58 | 600mm | 2025-07-10 | XS3109834112 | N | — |
| HY | SOFTBK | SoftBank | Japan | Senior | 7% | 3.84 | 2031-07-08 | — | 7.92% | — | 366bp | BB+/N.R | 96.25 | 95.74 | 500mm | 2024-07-08 | XS2854422818 | N | — |
| HY | SOFTBK | SoftBank | Japan | Senior | 8.25% | 4.01 | 2031-10-22 | — | 8.91% | — | 412bp | BB+/N.R | 97.37 | 98.83 | 600mm | 2026-04-22 | XS3344488864 | N | — |
| HY | SOFTBK | SoftBank | Japan | Senior | 9.25% | 4.19 | 2032-04-01 | — | 9.08% | — | 435bp | BB+/BB+ | 100.74 | 101.38 | 4.5bn | 2026-09-29 | USJ7600PAB97 | N | — |
| HY | SOFTBK | SoftBank | Japan | Senior | 7.25% | 4.49 | 2032-07-10 | — | 8.18% | — | 378bp | BB+/N.R | 95.66 | 95.04 | 600mm | 2025-07-10 | XS3112542272 | N | — |
| HY | SOFTBK | SoftBank | Japan | Senior | 9.75% | 5.22 | 2034-04-01 | — | 9.72% | — | 486bp | BB+/BB+ | 100.17 | 101.58 | 4.5bn | 2026-09-29 | USJ7600PAC70 | N | — |
| HY | SOFTBK | SoftBank | Japan | Senior | 7.5% | 6.09 | 2035-07-10 | — | 8.55% | — | 388bp | BB+/N.R | 93.51 | 94.06 | 500mm | 2025-07-10 | XS3112542355 | N | — |
| HY | SOFTBK | SoftBank | Japan | Senior | 8.5% | 6.42 | 2036-04-22 | — | 9.06% | — | 408bp | BB+/N.R | 96.45 | 98.39 | 500mm | 2026-04-22 | XS3344489169 | N | — |
| HY | SOFTBK | SoftBank hybrid | Japan | Sub | 7.63% | 3.59 | 2061-04-29 | 2031-04-29 | 8.37% | 9.98% | 309bp | BB+/N.R | 91.65 | 100.12 | 400mm | 2025-10-29 | XS3203997005 | N | — |
| HY | SOFTBK | SoftBank hybrid | Japan | Sub | 8.25% | 6.10 | 2065-10-29 | 2035-10-29 | 9.20% | 9.96% | 389bp | B+/N.R | 90.01 | 93.39 | 1.1bn | 2025-10-29 | XS3203997427 | N | — |
| HY | SOFTBK | SoftBank | Japan | Sub | 6.88% | 0.69 | PERP | 2027-07-18 | — | 7.75% | 639bp | B+/B1 | 99.17 | 99.21 | 1.8bn | 2017-07-19 | XS1642686676 | N | — |
| Hong Kong and Macau58 | Sen/Sub | Coupon | Dur | Maturity | Call | YTM | YTC | Z-S | RatingS&P/Moody’s/Fitch | PX from ETF | SPM PX | Total issue39.5bn | Issue date | ISIN | Def | Dm | |||
| Banking2 | |||||||||||||||||||
| Consumer2 | |||||||||||||||||||
| Diversified5 | |||||||||||||||||||
| Financial17 | |||||||||||||||||||
| Food and Beverage1 | |||||||||||||||||||
| Gaming14 | |||||||||||||||||||
| HY | SJMHOL | Champion Path | HK/Macau | Senior | 4.85% | 1.18 | 2028-01-27 | — | 7.36% | — | 434bp | B2/B | 96.50 | 96.65 | 500mm | 2021-01-27 | XS2289203551 | N | — |
| HY | STCITY | Studio City | HK/Macau | Senior | 5% | 2.04 | 2029-01-15 | — | 7.21% | — | 345bp | B+/B1 | 95.04 | 93.94 | 1.1bn | 2021-01-14 | USG85381AG95 | N | — |
| HY | SJMHOL | SJM | HK/Macau | Senior | 6.5% | 3.54 | 2031-01-15 | — | 9.06% | — | 485bp | B2/BB- | 90.70 | 91.96 | 540mm | 2026-01-15 | XS3267117995 | N | — |
| HY | MPEL | Melco | HK/Macau | Senior | 7.63% | 3.22 | 2032-04-17 | — | 7.66% | — | 290bp | BB-/Ba3 | 99.87 | 99.96 | 750mm | 2024-04-17 | USG5975LAK29 | N | — |
| HY | MPEL | Melco | HK/Macau | Senior | 6.5% | 4.93 | 2033-09-24 | — | 7.76% | — | 300bp | BB-/Ba3 | 93.29 | 93.10 | 500mm | 2025-09-24 | USG5975LAL02 | N | — |
| HY | WYNMAC | Wynn Macau | HK/Macau | Senior | 6.75% | 4.84 | 2034-02-15 | — | 7.47% | — | 280bp | BB-/B1/BB- | 95.94 | 94.62 | 1.0bn | 2025-08-19 | USG98149AM28 | N | — |
| Industrial Other1 | |||||||||||||||||||
| Other4 | |||||||||||||||||||
| HY | NWDEVL | NWD | HK/Macau | Senior | 4.13% | 2.49 | 2029-07-18 | — | 11.76% | — | 804bp | ***/N.R | 81.17 | 80.33 | 950mm | 2019-07-18 | XS2028401086 | N | — |
| HY | NWDEVL | NWD | HK/Macau | Senior | 4.5% | 3.13 | 2030-05-19 | — | 11.10% | — | 756bp | N.R/N.R | 79.12 | 80.83 | 600mm | 2020-05-19 | XS2175969125 | N | — |
| HY | NWDEVL | New World Dev | HK/Macau | Sub | 4.13% | 1.31 | PERP | 2028-03-09 | — | 23.52% | 2016bp | ***/N.R | 76.61 | 76.79 | 1.2bn | 2021-06-10 | XS2348062899 | N | — |
| Owned No Guarantee1 | |||||||||||||||||||
| HY | CINDBK | China CITIC Bank Intl | HK/Macau | Sub | 5% | 3.96 | PERP | 2031-07-21 | — | 5.08% | 68bp | Ba2 | 99.64 | 98.79 | 400mm | 2026-07-22 | XS3371242911 | N | — |
| Real Estate2 | |||||||||||||||||||
| IG | HYSAN | 7.2 PERP | HK/Macau | Sub | 7.2% | 3.43 | PERP | 2030-09-10 | — | 6.75% | 226bp | Baa3 | 101.56 | 102.16 | 750mm | 2025-03-10 | XS3012400746 | N | — |
| TMT1 | |||||||||||||||||||
| Transport2 | |||||||||||||||||||
| IG | MTRC | 5 5/8 PERP | HK/Macau | Sub | 5.625% | 6.94 | PERP | 2035-09-23 | — | 6.08% | 125bp | A/A2 | 96.89 | 97.04 | 1.5bn | 2025-06-23 | XS3094282343 | N | — |
| Transportation Services2 | |||||||||||||||||||
| Utilities3 | |||||||||||||||||||
| IG | CKINF | 4 PERP | HK/Macau | Sub | 4% | — | PERP | 2026-10-29 | — | — | — | BBB/N.R | 59.26 | 65.00 | 300mm | 2021-07-28 | XS2365668891 | N | — |
| Wirelines1 | |||||||||||||||||||
| HY | CASHLD | CAS Capital | HK/Macau | Sub | 6.25% | 3.66 | PERP | 2031-01-12 | — | 6.88% | 262bp | BB/Ba2 | 97.61 | 97.85 | 675mm | 2026-01-13 | XS3258406761 | N | — |
| India39 | Sen/Sub | Coupon | Dur | Maturity | Call | YTM | YTC | Z-S | RatingS&P/Moody’s/Fitch | PX from ETF | SPM PX | Total issue21.6bn | Issue date | ISIN | Def | Dm | |||
| Banking1 | |||||||||||||||||||
| HY | AXSBIN | Axis Bank | India | Sub | 6.88% | 4.14 | PERP | 2031-12-30 | — | 6.86% | 253bp | BB- | 100.09 | — | 600mm | 2026-06-30 | XS3311132552 | N | — |
| Chemicals1 | |||||||||||||||||||
| HY | UPLLIN | UPL | India | Senior | 4.63% | 3.23 | 2030-06-16 | — | 7.38% | — | 337bp | BB/Ba2/BB | 90.64 | 96.78 | 300mm | 2020-06-16 | XS2189565992 | N | — |
| Electric8 | |||||||||||||||||||
| HY | RPVIN | ReNew Treasury | India | Senior | 6.5% | 3.54 | 2031-02-02 | — | 7.16% | — | 281bp | Ba3/BB- | 97.49 | — | 600mm | 2026-02-02 | USY72910AA35 | N | — |
| HY | CWENIN | CGE Treasury | India | Senior | 7.88% | 3.57 | 2031-07-28 | — | 7.97% | — | 360bp | BB-/Ba3 | 99.65 | — | 390mm | 2026-07-28 | XS3451576899 | N | — |
| HY | CGRNEG | Continuum Green | India | Senior | 7.5% | 4.25 | 2033-06-26 | — | 7.26% | — | 279bp | Ba2 | 101.29 | — | 650mm | 2024-06-26 | USY8987LAA45 | N | — |
| IG | ADGREG | Parampujya Solar | India | Senior | 6.7% | 6.87 | 2042-03-12 | — | 7.42% | — | 226bp | Ba1/BBB- | 93.41 | 93.96 | 409mm | 2024-03-12 | XS2777626685 | N | — |
| Finance Companies4 | |||||||||||||||||||
| HY | IHFLIN | Samaan | India | Senior | 7.5% | 3.40 | 2030-10-16 | — | 8.22% | — | 352bp | B+/N.R | 97.57 | 98.42 | 450mm | 2025-10-16 | XS3205989232 | N | — |
| Financial6 | |||||||||||||||||||
| Financial Other5 | |||||||||||||||||||
| HY | FIHUCN | Fairfax India | India | Senior | 5% | 1.26 | 2028-02-26 | — | 7.42% | — | 385bp | BBB | 96.63 | — | 500mm | 2021-02-26 | US303897AA02 | N | — |
| HY | MUTHIN | Muthoot | India | Senior | 6.38% | 1.93 | 2029-04-23 | — | 7.15% | — | 251bp | BB+/BB+ | 98.27 | 98.82 | 650mm | 2024-10-23 | US62828M2D24 | N | — |
| Infrastructure1 | |||||||||||||||||||
| Metals and Mining4 | |||||||||||||||||||
| HY | VEDLN | Vedanta | India | Senior | 7% | 3.78 | 2032-07-13 | — | 7.29% | — | 286bp | BB/Ba3/BB | 98.60 | — | 625mm | 2026-07-13 | XS3427418432 | N | — |
| HY | VEDLN | Vedanta | India | Senior | 7.38% | 4.57 | 2034-07-13 | — | 7.66% | — | 306bp | BB/Ba3/BB | 98.34 | 96.83 | 750mm | 2026-07-13 | XS3427418606 | N | — |
| HY | VEDLN | Vedanta | India | Senior | 7.75% | 5.86 | 2037-07-13 | — | 7.96% | — | 315bp | BB/Ba3/BB | 98.51 | — | 775mm | 2026-07-13 | XS3427418788 | N | — |
| Oil & Gas2 | |||||||||||||||||||
| Owned No Guarantee2 | |||||||||||||||||||
| HY | GRNKEN | Greenko Wind | India | Senior | 7.25% | 1.56 | 2028-09-27 | — | 7.16% | — | 284bp | Ba3/BB | 100.17 | 100.00 | 1.0bn | 2025-03-27 | USV3856JAB99 | N | — |
| Pharmaceuticals1 | |||||||||||||||||||
| HY | BIOLIN | Biocon | India | Senior | 6.67% | 2.35 | 2029-10-09 | — | 7.08% | — | 250bp | BB+/BB | 98.90 | 99.02 | 800mm | 2024-10-09 | USG11185AA61 | N | — |
| Retailers1 | |||||||||||||||||||
| HY | FRETAI | Future Retail | India | Senior | 0% | 0.00 | 2025-01-22 | — | — | — | — | C | 0.00 | 0.25 | 500mm | 2020-01-22 | USY267BJGT59 | Y | — |
| Transportation Services3 | |||||||||||||||||||
| HY | DIALIN | Delhi Airport | India | Senior | 6.13% | 0.01 | 2026-10-31 | — | — | — | — | BB/Ba3/BB+ | 103.06 | 100.01 | 522.6mm | 2016-10-31 | USY2R27RAB56 | N | — |
| HY | IRBIN | IRB Infra | India | Senior | 7.11% | 3.51 | 2032-03-11 | — | 7.44% | — | 283bp | Ba2 | 98.55 | 98.77 | 740mm | 2024-03-11 | XS2775699577 | N | — |
| South Korea23 | Sen/Sub | Coupon | Dur | Maturity | Call | YTM | YTC | Z-S | RatingS&P/Moody’s/Fitch | PX from ETF | SPM PX | Total issue10.0bn | Issue date | ISIN | Def | Dm | |||
| Chemicals1 | |||||||||||||||||||
| Financial11 | |||||||||||||||||||
| Industrial4 | |||||||||||||||||||
| Infrastructure1 | |||||||||||||||||||
| Metals & Mining1 | |||||||||||||||||||
| TMT1 | |||||||||||||||||||
| Utilities4 | |||||||||||||||||||
| Singapore11 | Sen/Sub | Coupon | Dur | Maturity | Call | YTM | YTC | Z-S | RatingS&P/Moody’s/Fitch | PX from ETF | SPM PX | Total issue7.5bn | Issue date | ISIN | Def | Dm | |||
| Financial5 | |||||||||||||||||||
| Industrial1 | |||||||||||||||||||
| Other1 | |||||||||||||||||||
| HY | GLPSP | GLP | Singapore | Senior | 9.75% | 1.37 | 2028-05-20 | — | 17.85% | — | 1755bp | N.R/W.R | 86.86 | 86.75 | 1.0bn | 2025-05-20 | XS3071310059 | N | — |
| Owned No Guarantee2 | |||||||||||||||||||
| Refining1 | |||||||||||||||||||
| TMT1 | |||||||||||||||||||
| Indonesia10 | Sen/Sub | Coupon | Dur | Maturity | Call | YTM | YTC | Z-S | RatingS&P/Moody’s/Fitch | PX from ETF | SPM PX | Total issue7.2bn | Issue date | ISIN | Def | Dm | |||
| Consumer1 | |||||||||||||||||||
| Financial1 | |||||||||||||||||||
| Independent2 | |||||||||||||||||||
| HY | MEDCIJ | Medco Maple | Indonesia | Senior | 8.96% | 1.35 | 2029-04-27 | — | 8.13% | — | 344bp | B+/Ba3/BB- | 101.84 | 102.39 | 500mm | 2023-10-27 | USY5951MAA00 | N | — |
| HY | MEDCIJ | Medco Cypress | Indonesia | Senior | 8.63% | 2.41 | 2030-05-19 | — | 7.10% | — | 326bp | BB-/Ba3 | 105.25 | — | — | 2025-05-19 | USY56616AA68 | N | — |
| Metals & Mining1 | |||||||||||||||||||
| Metals and Mining2 | |||||||||||||||||||
| HY | INDYIJ | Indika | Indonesia | Senior | 8.75% | 1.82 | 2029-05-07 | — | 7.35% | — | 404bp | B1/BB- | 103.71 | 100.10 | 675mm | 2024-05-07 | USY71247AA15 | N | — |
| HY | NICAU | Nickel Industries | Indonesia | Senior | 9% | 2.98 | 2030-09-30 | — | 9.21% | — | 458bp | B1/B+ | 99.30 | 101.06 | 800mm | 2025-09-30 | USQ67949AD17 | N | — |
| Owned No Guarantee2 | |||||||||||||||||||
| HY | BMRIIJ | Bank Mandiri | Indonesia | Sub | 7.35% | 3.60 | PERP | 2031-09-10 | — | 8.05% | 348bp | Ba2 | 97.16 | — | 750mm | 2026-09-10 | XS3470501993 | N | — |
| HY | BBNIIJ | BNI | Indonesia | Sub | 7.15% | 3.79 | PERP | 2031-10-22 | — | 8.37% | 359bp | Ba3 | 95.11 | — | 700mm | 2026-04-22 | XS3343218866 | N | — |
| Utilities1 | |||||||||||||||||||
| Australia17 | Sen/Sub | Coupon | Dur | Maturity | Call | YTM | YTC | Z-S | RatingS&P/Moody’s/Fitch | PX from ETF | SPM PX | Total issue4.7bn | Issue date | ISIN | Def | Dm | |||
| Chemicals1 | |||||||||||||||||||
| Metals and Mining16 | |||||||||||||||||||
| HY | MINAU | Mineral Resources | Australia | Senior | 9.25% | 0.34 | 2028-10-01 | — | 7.46% | — | 310bp | Ba3 | 103.28 | — | 750mm | 2023-10-03 | US603051AE37 | N | — |
| HY | INFRAB | Infrabuild | Australia | Senior | 14.5% | 0.93 | 2028-11-15 | — | 9.32% | — | 660bp | Caa2 | 111.33 | — | 550mm | 2023-11-15 | US45682RAC43 | N | — |
| HY | CRNAU | Coronado | Australia | Senior | 9.25% | 2.51 | 2029-10-01 | — | 16.98% | — | 1215bp | B-/Caa2 | 82.40 | — | 400mm | 2024-10-02 | USQ2874LAB01 | N | — |
| HY | PLSAU | PLS | Australia | Senior | 8% | 4.18 | 2032-11-01 | — | 8.09% | — | 390bp | — | 99.54 | — | — | 2026-10-23 | USQ7539CAB65 | N | — |
| Philippines16 | Sen/Sub | Coupon | Dur | Maturity | Call | YTM | YTC | Z-S | RatingS&P/Moody’s/Fitch | PX from ETF | SPM PX | Total issue4.6bn | Issue date | ISIN | Def | Dm | |||
| Airlines1 | |||||||||||||||||||
| HY | PALPM | Primero Agila | Philippines | Senior | 7.75% | 3.78 | 2031-07-16 | — | 10.56% | — | 629bp | Ba2 | 89.30 | — | 350mm | 2026-07-16 | USG7261AAA72 | N | — |
| Electric4 | |||||||||||||||||||
| HY | SMCGL | San Miguel Power | Philippines | Sub | 8.75% | 2.31 | PERP | 2029-06-12 | — | 8.56% | 504bp | N.R/N.R | 100.49 | — | 900mm | 2024-09-12 | XS2883979705 | N | — |
| HY | SMCGL | San Miguel Power | Philippines | Sub | 8.13% | 2.64 | PERP | 2029-12-01 | — | 7.72% | 399bp | N.R/N.R | 101.25 | 99.05 | 600mm | 2024-12-02 | XS2943809900 | N | — |
| HY | SMCGL | San Miguel Power | Philippines | Sub | 8.95% | 2.93 | PERP | 2030-04-24 | — | 8.35% | 362bp | N.R/N.R | 101.80 | — | 515mm | 2025-07-24 | XS3121131125 | N | — |
| HY | SMCGL | San Miguel Power | Philippines | Sub | 8.88% | 3.51 | PERP | 2031-03-17 | — | 8.48% | 392bp | N.R/N.R | 101.45 | — | 430mm | 2026-06-17 | XS3401031656 | N | — |
| Financial1 | |||||||||||||||||||
| Food and Beverage1 | |||||||||||||||||||
| Industrial Other2 | |||||||||||||||||||
| Other4 | |||||||||||||||||||
| HY | VLLPM | VLL Intl | Philippines | Senior | 7.25% | 0.69 | 2027-07-20 | — | 31.90% | — | 3685bp | N.R/N.R | 80.20 | 100.25 | 425mm | 2020-07-20 | XS2205566206 | N | — |
| HY | VLLPM | VLL Intl | Philippines | Senior | 9.38% | 2.26 | 2029-07-29 | — | 28.27% | — | 2432bp | N.R/N.R | 63.41 | 100.25 | 425mm | 2024-07-29 | XS2758096759 | N | — |
| Refining1 | |||||||||||||||||||
| HY | PCORPM | Petron | Philippines | Sub | 7.35% | 1.68 | PERP | 2028-08-22 | — | 7.46% | 358bp | N.R | 99.80 | — | 475mm | 2025-09-22 | XS3178401793 | N | — |
| Transportation Services1 | |||||||||||||||||||
| Utility Other1 | |||||||||||||||||||
| Thailand10 | Sen/Sub | Coupon | Dur | Maturity | Call | YTM | YTC | Z-S | RatingS&P/Moody’s/Fitch | PX from ETF | SPM PX | Total issue4.3bn | Issue date | ISIN | Def | Dm | |||
| Banking2 | |||||||||||||||||||
| Chemicals2 | |||||||||||||||||||
| HY | PTTGC | GC Treasury PERP NC10 | Thailand | Sub | 7.13% | 6.17 | PERP | 2035-09-10 | — | 7.68% | 286bp | Ba2/BB | 96.48 | 96.38 | 500mm | 2025-09-10 | USY3004DAE41 | N | — |
| HY | PTTGC | GC Treasury PERP NC5.25 | Thailand | Sub | 6.5% | 3.30 | PERP | 2030-12-10 | — | 6.85% | 275bp | Ba2 | 98.65 | 96.88 | 600mm | 2025-09-10 | USY3004DAD67 | N | — |
| Finance Companies1 | |||||||||||||||||||
| HY | MTCTB | Muangthai | Thailand | Senior | 7.55% | 2.13 | 2030-07-21 | — | 7.23% | — | 302bp | BB-/BB | 101.10 | 100.00 | 350mm | 2025-07-21 | XS3113144912 | N | — |
| Financial2 | |||||||||||||||||||
| Oil & Gas2 | |||||||||||||||||||
| Refining1 | |||||||||||||||||||
| HY | TOPTB | ThaiOil | Thailand | Sub | 6.1% | 3.67 | PERP | 2031-01-14 | — | 7.27% | 301bp | BB-/Ba2 | 95.59 | 96.22 | 600mm | 2026-01-15 | USY86218AC16 | N | — |
| Malaysia5 | Sen/Sub | Coupon | Dur | Maturity | Call | YTM | YTC | Z-S | RatingS&P/Moody’s/Fitch | PX from ETF | SPM PX | Total issue3.0bn | Issue date | ISIN | Def | Dm | |||
| Consumer1 | |||||||||||||||||||
| IG | GENMMK | 3.882 04/19/31 | Malaysia | Senior | 3.882% | 3.98 | 2031-04-19 | — | 7.81% | — | 308bp | BBB-/BBB- | 85.32 | 87.32 | 1.0bn | 2021-04-18 | USY2700RAA06 | N | — |
| Financial1 | |||||||||||||||||||
| Gaming2 | |||||||||||||||||||
| HY | GENTMK | GOHL NC10 | Malaysia | Sub | 8.3% | 6.29 | PERP | 2036-04-29 | — | 11.16% | 605bp | Ba2/BB | 83.52 | 91.33 | 750mm | 2026-04-29 | XS3357513533 | N | — |
| HY | GENTMK | GOHL NC5.5 | Malaysia | Sub | 7.63% | 4.07 | PERP | 2031-10-29 | — | 11.80% | 683bp | Ba2/BB | 84.59 | 91.33 | 750mm | 2026-04-29 | XS3357500472 | N | — |
| TMT1 | |||||||||||||||||||
| Pakistan3 | Sen/Sub | Coupon | Dur | Maturity | Call | YTM | YTC | Z-S | RatingS&P/Moody’s/Fitch | PX from ETF | SPM PX | Total issue1.9bn | Issue date | ISIN | Def | Dm | |||
| Owned No Guarantee1 | |||||||||||||||||||
| HY | PAKWNP | Pakistan WAPDA | Pakistan | Senior | 7.5% | 3.71 | 2031-06-04 | — | 8.33% | — | 425bp | B-/B | 96.66 | — | 500mm | 2021-06-04 | XS2348591707 | N | — |
| Wireless2 | |||||||||||||||||||
| HY | VEONHD | VEON | Pakistan | Senior | 6.95% | 3.53 | 2031-06-01 | — | 7.05% | — | 293bp | BB-/BB- | 99.57 | — | 700mm | 2026-06-01 | XS3372847957 | N | — |
| HY | VEONHD | VEON | Pakistan | Senior | 7.45% | 4.50 | 2033-06-01 | — | 7.55% | — | 316bp | BB-/BB- | 99.49 | — | 700mm | 2026-06-01 | XS3372848419 | N | — |
| Taiwan5 | Sen/Sub | Coupon | Dur | Maturity | Call | YTM | YTC | Z-S | RatingS&P/Moody’s/Fitch | PX from ETF | SPM PX | Total issue1.7bn | Issue date | ISIN | Def | Dm | |||
| Financial1 | |||||||||||||||||||
| Industrial4 | |||||||||||||||||||
| Mongolia3 | Sen/Sub | Coupon | Dur | Maturity | Call | YTM | YTC | Z-S | RatingS&P/Moody’s/Fitch | PX from ETF | SPM PX | Total issue1.6bn | Issue date | ISIN | Def | Dm | |||
| Banking1 | |||||||||||||||||||
| HY | GLMTMO | Golomt Bank | Mongolia | Senior | 7.95% | 2.21 | 2029-05-14 | — | 7.00% | — | 357bp | B+/B+ | 102.52 | — | 500mm | 2026-05-14 | USY27906AD16 | N | — |
| Metals and Mining1 | |||||||||||||||||||
| HY | MONMIN | Mongolian Mining | Mongolia | Senior | 8.44% | 2.50 | 2030-04-03 | — | 8.13% | — | 354bp | B2 | 100.93 | — | 350mm | 2025-04-03 | XS3038559129 | N | — |
| Owned No Guarantee1 | |||||||||||||||||||
| HY | DBMMN | DB Mongolia | Mongolia | Senior | 6.9% | 3.88 | 2031-07-02 | — | 7.28% | — | 302bp | BB-/B1 | 98.45 | — | 750mm | 2026-07-02 | USY2056PAJ58 | N | — |
Build a concentrated Asia USD public-bond book from the Premia 3411 + BlackRock 09P universe (holdings as-of 30 Oct 2026). Pick 10 / 20 / 30 names. Bonds are ranked by issue size, scaled down by deviation from target duration; the top N are kept and re-normalized so weights sum to 100% by issue size (same top-N then rescale idea as Top Investors). Not equal-weight; not ETF holdings-weight or Z-weighted. Optionally skip countries and exclude up to 2 tickers below before ranking; choose target duration 2y / 3y / 4y / 5y (selection biased toward that duration; book weights stay issue-size) (optional). Minimum piece typically US$200k. Eligible: non-defaulted (hard-excluded before ranking), valid Z-S, known issue size, Price ≥ 20 (315 bonds). One line per ISIN. Result table includes Sen/Sub. Bottom summary (after build): Weighted Z, Weighted Z hist, running yield (weighted) (coupon ÷ ETF PX × 100), and portfolio duration (target). Example 1 (N=10 · skip India/Indonesia/Pakistan/Sov·Quasi · skip Z < 100 · target 3y · IG 50% · no-dupe) loads by default so the top names are visible on open. Z history column uses 2026-10-14 (16d lag — shorter than ~30d until history deepens). Indicative only — not investment advice.
Checked countries and typed tickers (optional, blank by default) are dropped from the pool; skipping Indonesia / Pakistan also drops matching Sov/Quasi tickers (INDON, INDOIS, PERTIJ, PLNIJ / PKSTAN, PAKWNP). Bonds with Z < 0 are hard-excluded; optional Skip Z < 100 (Example 1 default ON) also drops 0 ≤ Z < 100. Then select via takeMix (issue size + target-duration bias + IG share); optional No dupe by issuer keeps ≤1 ISIN per ticker; top N re-normalized to 100% by issue size. Example 1 loads by default (N=10 · skip India/Indonesia/Pakistan/Sov·Quasi · skip Z < 100 · target 3y · IG 50% · no-dupe ON) so the top names show without clicking Build.
| # | IG/HY | Ticker | Name | Country | Rating | ISIN | Sen/Sub | Coupon | Price | Maturity/Call | Issue size wt | Z | Z 14 Oct | Dur |
|---|
Weights = issue size share of the 10, re-normalised to 100%.
Issue-size weight → top N → re-scale to 100% · defaulted hard-excluded · optional skip-country · min piece typically US$200k · Sen/Sub · Dur / Z / Z 14 Oct · ISIN · target Dur 2/3/4/5y · no dupe by issuer · Z≥0 hard · Skip Z<100 · bottom: Weighted Z + Z hist + RY + portfolio Dur · exclude ≤2 tickers (optional) · soft-fail blanks · not investment advice.
Landmark China corporate defaults most relevant to overseas credit investors — not property-only. Ranked by the widely cited stocktake figure for each name: total (or net) liabilities for mega non-property restructurings / insolvencies; offshore USD (bonds + loans where reported) for property developers, kept on a comparable offshore basis. China property offshore USD defaults alone still >US$150bn+ (Debtwire 2025). Top 10:
- 1. HNA Group — ~US$170bn (Nikkei Asia Oct 2021; total liabilities in bankruptcy · airline / conglomerate)
- 2. Zhongzhi Enterprise — ~US$58–64bn (Reuters / China Daily Nov 2023; liabilities RMB420–460bn · shadow bank / WMP)
- 3. Tsinghua Unigroup — ~US$30–31bn (SCMP / Caixin; liabilities >RMB200bn / ~RMB202.9bn · semis)
- 4. Evergrande — ~US$23bn offshore (Reuters / Debtwire; total liab >US$300bn+ at liquidation — ranked on offshore for property comparability · property)
- 5. CEFC China Energy — ~US$18.5bn (Bloomberg Law / Caixin 2020; net liabilities RMB130.75bn at Shanghai bankruptcy · energy / overseas M&A)
- 6. Country Garden — ~US$16–18bn offshore (Bondsupermart / Debtwire; ~US$17.7bn plan · property)
- 7. Kaisa — ~US$12–13bn offshore (HKEX / Debtwire; ~US$12.3–13.8bn · property)
- 8. Shimao — ~US$11–12bn offshore (Reuters Feb 2025; ~US$11.7bn · property)
- 9. Sunac — ~US$10bn offshore (Sidley; US$10.2bn then US$9.6bn scheme · property)
- 10. CIFI — ~US$8.1bn offshore (Linklaters / Houlihan Lokey Dec 2025 · property)
Indicative stocktake only (not live marks). Universe = China defaults overseas investors care about (offshore / hard-currency footprint or landmark conglomerate / shadow-bank cases), not China property alone. Basis differs by name (total/net liabilities vs offshore USD) — see each line. Property offshore sector still >US$150bn+ bonds-only since H2 2021 (Debtwire). Huarong (state recap, no clean default stocktake), Anbang/Dajia (takeover/bailout), Brilliance (mainly onshore), Founder (~US$3bn offshore) and Tewoo (~US$1–2bn offshore) omitted — no clean figure large enough on this ranking basis, or not a clean default. Dropped vs prior property-only Top 10: Logan, Aoyuan, Fantasia, Yuzhou. Sources: Nikkei Asia, Reuters, China Daily, SCMP, Caixin, Bloomberg Law, Debtwire, HKEX, Bondsupermart, Sidley, Linklaters. Not investment advice.