Core 2.57% ▲ from 2.45%
Top 19 news (S&P 500 universe · past week · includes editor-pinned lead)
Most-clicked / important / high-impact stories for S&P 500 constituents (company names or tickers in this universe). Sources: FT, Bloomberg, Reuters, WSJ, Nikkei Asia, S&P Global Ratings, Moody’s. Window: past 7 days. Ranked cap 18. 1 editor-pinned lead sits above the ranked list.
- Binance Discovers Multiple Breach Points in $6.3 Billion Hack, Targets Sunday Withdrawal Restart · CoinDesk/CNBC/AP · 2026-10-30
- U.S. Stocks Slide as Amazon, Intel Earnings Spark More AI Selling · FT/BBG/Reuters/WSJ · 2026-10-30 · hit: Amazon
- Intel Shares Plunge More Than 20% on Weak PC-Market Outlook · FT/Reuters/WSJ/Nikkei · 2026-10-29 · hit: Intel
- Apple’s $1 Trillion Rally Leaves No Room for Error on Earnings · Bloomberg · 2026-11-02 · hit: Apple
- Memory chip makers outearn Alphabet, other tech giants on AI demand · Nikkei · 2026-10-30 · hit: Alphabet
- Broadcom Inc. Outlook Revised To Stable From Positive On Rising AI Risk; 'A-' Rating Affirmed · S&P · 2026-10-29 · hit: Broadcom
- Morgan Stanley Residential Mortgage Loan Trust 2026-NQM11 Certificates Assigned Ratings · S&P · 2026-10-30 · hit: Morgan Stanley
- Microsoft and Alphabet have gone in different directions since their last earnings reports · X · 2026-10-28 · hit: MSFT vs GOOGL
- Alphabet $GOOGL initially trades down 7% and Microsoft $MSFT up 5% in reaction to earnings · X · 2026-10-28 · hit: MSFT GOOGL AH reaction
- Apple's new CEO Ternus to face first earnings test as memory costs surge · Reuters · 2026-11-02 · hit: Apple
- Altria Lifts Earnings Outlook as Profit, Revenue Climb · WSJ · 2026-10-29 · hit: Altria
- Chinese Executive Close to Nvidia CEO Suspected of Giving China Information · WSJ · 2026-10-31 · hit: Nvidia
- The Shopping Bots Are Coming for Amazon · WSJ · 2026-11-01 · hit: Amazon
- Intel Suffers Worst Stock Thrashing in Decades on Weak Forecast · Bloomberg · 2026-10-30 · hit: Intel
- Alphabet kicks off €6 billion bond sale, tests appetite for tech debt · Reuters · 2026-11-02 · hit: Alphabet
- Marvell doubles down on AI boom with costly $115 billion Lumentum deal · Reuters · 2026-11-02 · hit: Lumentum
- Chip Maker Marvell Agrees to Buy Lumentum in $80 Billion Deal · WSJ · 2026-11-02 · hit: Lumentum
- Oracle Is Offering $10 Billion of High-Grade Dollar Bonds · Bloomberg · 2026-11-02 · hit: Oracle
- Apple warns on rising costs from memory chip shortage · FT · 2026-11-02 · hit: Apple
Same logic as AT1 CoCo bank-news box: multi-source Google News RSS · last 7 days · deduped by URL/topic · impact/importance/clicks-proxy + round-robin across sources · X secondary fill only (high-follower / high-engagement; ≤2; prefer press on same event) · max 18 (9 outlets × hard cap 2) · agency headlines prefer rating actions / outlook / CreditWatch. · fetched 2026-11-02 23:23:02
vs S&P YTD / vs S&P 24m = that stock’s YTD or 24-month total return minus the S&P 500 index total return over the same period (positive = beat the index; negative = lagged). Index source shown in the cards above.
Ask Gemini opens Google AI Mode (Gemini) with your question prefilled —
native gemini.google.com has no reliable ?q= deep link.
Open Gemini app copies the question and opens the Gemini chat UI for paste.
Ticker filter above stays separate.
“why is Fair Isaac (FICO) down so much in YTD and 24mth?”
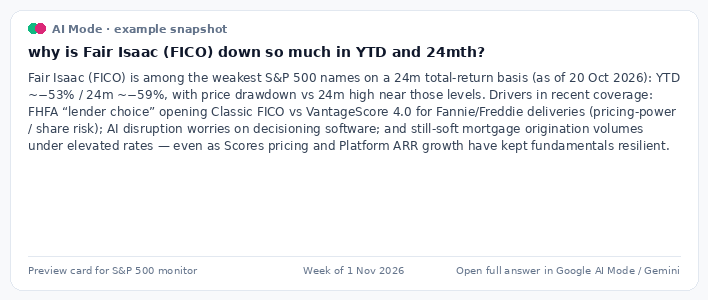
Fair Isaac (FICO) is among the weakest S&P 500 names on a 24m total-return basis (as of 20 Oct 2026): YTD ~−53% / 24m ~−59%, with price drawdown vs 24m high in a similar range (peak late 2024 / early 2025). Drivers in recent coverage: FHFA “lender choice” letting loans delivered to Fannie/Freddie use Classic FICO or VantageScore 4.0 (pricing-power and share risk in mortgage scores); AI disruption worries that could compress decisioning software differentiation; and still-soft mortgage origination volumes under elevated rates and affordability pressure — even while Scores price increases and Platform ARR growth have kept reported fundamentals resilient.
Preview · themes from recent coverage (not a live Gemini capture)
Themes from Yahoo Finance / Investing.com / Motley Fool coverage of FICO FHFA lender choice, AI competition concerns, and mortgage volume commentary (2025–2026).
“why is Charter (CHTR) down so much in YTD and 24mth?”
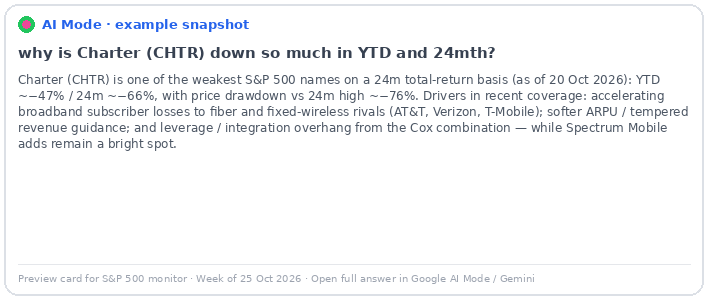
Charter (CHTR) is one of the weakest S&P 500 names on a 24m total-return basis (as of 20 Oct 2026): YTD ~−47% / 24m ~−66%, with price drawdown vs 24m high ~−76% (peak 2025-05-16). Drivers in recent coverage: accelerating broadband subscriber losses to fiber and fixed-wireless rivals (AT&T, Verizon, T-Mobile); softer ARPU and tempered revenue guidance; and leverage / Cox integration overhang — while Spectrum Mobile line adds remain a relative bright spot.
Preview · themes from recent coverage (not a live Gemini capture)
Themes from Reuters / WSJ / MarketWatch coverage of Charter broadband losses, ARPU and Cox combination (2025–2026).
Sorts the main table below. # = worst first under the active mode (default 24m TR). Restore original returns to that mode after a column-header sort.
| # | Ticker | Company | Sector | Industry | Market Cap USD bn |
EV USD bn |
EV/ EBITDA TTM multiple |
YTD TR | 24m TR | 12m TR | TR from peak | vs S&P YTD |
vs S&P 24m |
Price drawdown vs peak |
Max drawdown (24m) |
Peak date |
|---|---|---|---|---|---|---|---|---|---|---|---|---|---|---|---|---|
| 1 | FISV | Fiserv | Financials | Transaction & Payment Processing Services | 27.6 | 27.6 | 3.4 | -22.7% | -74.3% | -22.1% | -78.2% | -33.9% | -109.2% | -78.2% | -81.3% | 2025-03-03 |
| 2 | CHTR | Charter Communications | Communication Services | Cable & Satellite | 13.2 | 114.4 | 5.2 | -44.6% | -68.5% | -50.6% | -73.0% | -55.8% | -103.4% | -73.0% | -76.1% | 2025-05-16 |
| 3 | LULU | Lululemon Athletica | Consumer Discretionary | Apparel, Accessories & Luxury Goods | 12.5 | 12.6 | 5.3 | -48.1% | -66.4% | -36.8% | -74.4% | -59.3% | -101.3% | -74.4% | -78.2% | 2025-01-30 |
| 4 | FICO | Fair Isaac | Information Technology | Application Software | 15.6 | 20.7 | 16.4 | -57.2% | -63.6% | -56.4% | -69.6% | -68.4% | -98.5% | -69.6% | -75.1% | 2024-11-26 |
| 5 | ARE | Alexandria Real Estate Equities | Real Estate | Office REITs | 7.4 | 23.4 | 13.7 | -9.1% | -56.7% | -22.5% | -57.9% | -20.3% | -91.6% | -62.7% | -65.0% | 2024-11-08 |
| 6 | CSGP | CoStar Group | Real Estate | Real Estate Services | 12.8 | 12.8 | 23.0 | -52.7% | -56.1% | -53.8% | -67.1% | -63.9% | -91.0% | -67.1% | -72.2% | 2025-08-04 |
| 7 | IT | Gartner | Information Technology | IT Consulting & Other Services | 14.9 | 16.3 | 11.8 | -6.8% | -53.3% | -5.3% | -57.4% | -17.9% | -88.2% | -57.4% | -77.2% | 2024-11-13 |
| 8 | ZTS | Zoetis | Health Care | Pharmaceuticals | 34.4 | 40.5 | 10.0 | -32.4% | -52.6% | -41.0% | -51.8% | -43.6% | -87.5% | -53.5% | -61.4% | 2024-12-12 |
| 9 | FIS | Fidelity National Information Services | Financials | Transaction & Payment Processing Services | 20.7 | 40.4 | 11.5 | -37.7% | -52.2% | -33.3% | -52.6% | -48.9% | -87.2% | -55.2% | -63.8% | 2024-11-04 |
| 10 | ADBE | Adobe Inc. | Information Technology | Application Software | 97.9 | 98.5 | 9.9 | -28.1% | -47.9% | -26.1% | -54.5% | -39.3% | -82.8% | -54.5% | -65.0% | 2024-12-06 |
| 11 | NKE | Nike, Inc. | Consumer Discretionary | Apparel, Accessories & Luxury Goods | 58.1 | 60.2 | 12.3 | -37.0% | -47.1% | -37.4% | -49.7% | -48.2% | -82.0% | -52.1% | -58.5% | 2025-02-25 |
| 12 | BSX | Boston Scientific | Health Care | Health Care Equipment | 64.2 | 73.2 | 12.8 | -53.5% | -47.0% | -56.0% | -59.0% | -64.7% | -81.9% | -59.0% | -61.5% | 2025-09-08 |
| 13 | DECK | Deckers Brands | Consumer Discretionary | Footwear | 11.3 | 10.3 | 7.4 | -18.0% | -46.2% | +4.3% | -61.9% | -29.2% | -81.2% | -61.9% | -65.3% | 2025-01-30 |
| 14 | CMG | Chipotle Mexican Grill | Consumer Discretionary | Restaurants | 41.6 | 45.0 | 19.9 | -11.1% | -43.8% | +3.9% | -50.3% | -22.2% | -78.7% | -50.3% | -58.4% | 2024-12-12 |
| 15 | NOW | ServiceNow | Information Technology | Systems Software | 110.0 | 112.9 | 34.9 | -30.8% | -43.8% | -42.3% | -54.7% | -42.0% | -78.7% | -54.7% | -64.5% | 2025-01-28 |
| 16 | GIS | General Mills | Consumer Staples | Packaged Foods & Meats | 18.6 | 31.5 | 9.2 | -20.1% | -43.1% | -20.3% | -43.1% | -31.3% | -78.0% | -49.1% | -53.6% | 2024-11-05 |
| 17 | LEN | Lennar | Consumer Discretionary | Homebuilding | 21.7 | 25.7 | 13.0 | -9.5% | -42.4%* | -24.8% | -45.3% | -20.7% | -77.3% | -47.4% | -57.5% | 2024-11-25 |
| 18 | INTU | Intuit | Information Technology | Application Software | 94.1 | 92.4 | 13.5 | -46.1% | -42.2% | -46.5% | -55.7% | -57.3% | -77.1% | -56.4% | -68.4% | 2025-07-30 |
| 19 | COO | Cooper Companies (The) | Health Care | Health Care Supplies | 11.7 | 14.0 | 15.0 | -25.2% | -42.1% | -12.3% | -41.7% | -36.4% | -77.0% | -41.7% | -49.4% | 2024-11-05 |
| 20 | LII | Lennox International | Industrials | Building Products | 12.1 | 13.8 | 11.7 | -26.5% | -40.2% | -29.1% | -46.8% | -37.7% | -75.1% | -47.9% | -51.0% | 2024-11-25 |
| 21 | CLX | Clorox | Consumer Staples | Household Products | 10.9 | 16.3 | 14.3 | -6.3% | -39.9% | -16.0% | -42.3% | -17.5% | -74.8% | -47.0% | -52.6% | 2024-12-05 |
| 22 | CPRT | Copart | Industrials | Diversified Support Services | 29.6 | 23.5 | 12.6 | -18.4% | -38.0% | -25.8% | -50.0% | -29.6% | -72.9% | -50.0% | -58.9% | 2025-05-16 |
| 23 | CMCSA | Comcast | Communication Services | Cable & Satellite | 84.8 | 162.4 | 4.8 | -10.2% | -36.1%* | -3.6% | -38.3% | -21.4% | -71.0% | -43.6% | -51.2% | 2024-11-06 |
| 24 | STZ | Constellation Brands | Consumer Staples | Distillers & Vintners | 23.8 | 33.4 | 9.8 | +5.0% | -35.9% | +10.2% | -39.2% | -6.2% | -70.8% | -42.4% | -53.8% | 2024-12-09 |
| 25 | PODD | Insulet Corporation | Health Care | Health Care Equipment | 10.7 | 10.9 | 17.7 | -46.0% | -34.8% | -50.9% | -56.5% | -57.2% | -69.7% | -56.5% | -63.0% | 2025-09-09 |
| 26 | MKC | McCormick & Company | Consumer Staples | Packaged Foods & Meats | 13.1 | 18.0 | 12.0 | -26.2% | -34.2% | -21.2% | -39.2% | -37.5% | -69.1% | -42.4% | -47.9% | 2025-03-03 |
| 27 | TYL | Tyler Technologies | Information Technology | Application Software | 16.1 | 16.3 | 34.1 | -11.0% | -33.0% | -15.2% | -37.5% | -22.2% | -67.9% | -37.5% | -57.4% | 2025-02-13 |
| 28 | PCG | PG&E Corporation | Utilities | Multi-Utilities | 39.9 | 95.4 | 8.9 | -16.5% | -32.5% | -15.7% | -37.4% | -27.7% | -67.4% | -38.6% | -44.8% | 2024-11-27 |
| 29 | NVR | NVR, Inc. | Consumer Discretionary | Homebuilding | 16.7 | 15.7 | 11.0 | -14.1% | -31.4% | -13.1% | -33.7% | -25.3% | -66.4% | -33.7% | -41.2% | 2024-11-05 |
| 30 | ERIE | Erie Indemnity | Financials | Insurance Brokers | 14.3 | 13.3 | 16.0 | -2.2% | -31.4% | -4.2% | -37.0% | -13.4% | -66.3% | -39.2% | -54.0% | 2025-03-10 |
| 31 | TSCO | Tractor Supply | Consumer Discretionary | Other Specialty Retail | 18.4 | 24.2 | 12.8 | -28.0% | -31.1% | -33.2% | -42.3% | -39.2% | -66.0% | -43.6% | -53.5% | 2025-08-28 |
| 32 | BAX | Baxter International | Health Care | Health Care Equipment | 12.5 | 18.7 | 10.2 | +26.9% | -30.8% | +31.4% | -32.8% | +15.7% | -65.7% | -33.8% | -56.8% | 2025-03-07 |
| 33 | BRO | Brown & Brown | Financials | Insurance Brokers | 23.8 | 30.2 | 12.8 | -9.1% | -29.9% | -9.0% | -41.5% | -20.3% | -64.8% | -42.2% | -56.3% | 2025-04-03 |
| 34 | GDDY | GoDaddy | Information Technology | Internet Services & Infrastructure | 14.8 | 16.9 | 11.8 | -6.0% | -28.6% | -12.4% | -45.6% | -17.2% | -63.5% | -45.6% | -65.0% | 2025-01-28 |
| 35 | IP | International Paper | Materials | Paper & Plastic Packaging Products & Materials | 19.4 | 28.6 | 7.5 | -3.6% | -28.5% | -0.5% | -34.2% | -14.8% | -63.4% | -39.0% | -51.1% | 2025-01-24 |
| 36 | ORCL | Oracle Corporation | Information Technology | Application Software | 361.4 | 532.6 | 15.5 | -38.0% | -28.2% | -54.0% | -63.1% | -49.2% | -63.1% | -63.7% | -65.0% | 2025-09-10 |
| 37 | NCLH | Norwegian Cruise Line Holdings | Consumer Discretionary | Hotels, Resorts & Cruise Lines | 8.2 | 23.8 | 9.5 | -19.6% | -27.9% | -20.0% | -38.3% | -30.8% | -62.8% | -38.3% | -51.4% | 2025-01-30 |
| 38 | KKR | KKR & Co. | Financials | Asset Management & Custody Banks | 88.0 | 145.3 | 14.9 | -22.7% | -27.9% | -16.6% | -40.7% | -33.9% | -62.8% | -41.3% | -49.8% | 2025-01-31 |
| 39 | WY | Weyerhaeuser | Real Estate | Timber REITs | 15.3 | 19.7 | 26.8 | -7.7% | -27.1% | -4.1% | -29.8% | -18.9% | -62.0% | -34.2% | -42.9% | 2024-11-27 |
| 40 | BF.B | Brown–Forman | Consumer Staples | Distillers & Vintners | 13.8 | 15.3 | 12.9 | +18.2% | -26.8% | +14.0% | -29.7% | +7.0% | -61.7% | -33.9% | -49.8% | 2024-12-05 |
| 41 | PNR | Pentair | Industrials | Industrial Machinery & Supplies & Components | 11.3 | 12.1 | 12.5 | -31.2% | -26.5% | -32.7% | -36.2% | -42.4% | -61.4% | -37.3% | -53.7% | 2025-09-11 |
| 42 | ALGN | Align Technology | Health Care | Health Care Supplies | 10.9 | 9.6 | 10.1 | -1.3% | -26.1% | +11.8% | -35.9% | -12.5% | -61.0% | -35.9% | -48.1% | 2024-11-25 |
| 43 | UNH | UnitedHealth Group | Health Care | Managed Health Care | 359.4 | 414.3 | 14.3 | +23.7% | -26.0% | +20.4% | -32.8% | +12.5% | -60.9% | -36.0% | -62.0% | 2024-11-11 |
| 44 | EFX | Equifax | Industrials | Research & Consulting Services | 22.6 | 26.8 | 13.2 | -10.5% | -25.8% | -7.8% | -30.3% | -21.7% | -60.7% | -31.4% | -51.1% | 2025-05-19 |
| 45 | TMUS | T-Mobile US | Communication Services | Wireless Telecommunication Services | 169.6 | 279.1 | 7.9 | -19.9% | -25.7% | -22.1% | -39.6% | -31.1% | -60.6% | -41.3% | -46.3% | 2025-03-03 |
| 46 | VRSK | Verisk Analytics | Industrials | Research & Consulting Services | 26.2 | 29.6 | 19.5 | -9.2% | -25.7% | -7.0% | -36.5% | -20.4% | -60.6% | -37.3% | -51.2% | 2025-06-04 |
| 47 | COIN | Coinbase | Financials | Financial Exchanges & Data | 36.5 | 36.1 | 132.8 | -39.0% | -24.6% | -59.9% | -67.2% | -50.2% | -59.5% | -67.2% | -67.2% | 2025-07-18 |
| 48 | MOS | Mosaic Company (The) | Materials | Fertilizers & Agricultural Chemicals | 6.0 | 11.8 | 6.9 | -18.9% | -24.4% | -28.1% | -47.5% | -30.1% | -59.3% | -49.7% | -54.3% | 2025-07-02 |
| 49 | BX | Blackstone Inc. | Financials | Asset Management & Custody Banks | 90.2 | 118.1 | — | -19.6% | -24.0% | -14.8% | -35.8% | -30.8% | -58.9% | -39.6% | -48.7% | 2024-11-22 |
| 50 | SKYD | Skydance | Communication Services | Movies & Entertainment | 40.7 | 24.5 | 7.4 | -38.9% | -24.0% | -46.6% | -58.3% | -50.1% | -58.9% | -59.1% | -65.5% | 2025-09-23 |
| 51 | HRL | Hormel Foods | Consumer Staples | Packaged Foods & Meats | 11.8 | 13.7 | 10.8 | -4.4% | -23.6% | +5.0% | -29.6% | -15.6% | -58.5% | -36.0% | -42.8% | 2024-12-10 |
| 52 | PYPL | PayPal | Financials | Transaction & Payment Processing Services | 48.8 | 51.3 | 7.9 | +1.6% | -23.1% | -14.2% | -35.3% | -9.6% | -58.0% | -36.0% | -57.4% | 2025-01-17 |
| 53 | FDS | FactSet | Financials | Financial Exchanges & Data | 12.1 | 12.9 | 14.3 | +20.1% | -23.0% | +31.1% | -28.7% | +8.9% | -57.9% | -30.7% | -61.7% | 2024-11-14 |
| 54 | LVS | Las Vegas Sands | Consumer Discretionary | Casinos & Gaming | 24.7 | 36.0 | 8.1 | -40.3% | -22.9% | -34.2% | -44.1% | -51.5% | -57.9% | -45.0% | -48.6% | 2025-12-01 |
| 55 | CRM | Salesforce | Information Technology | Application Software | 186.1 | 219.6 | 17.0 | -14.0% | -22.1% | -12.4% | -37.6% | -25.2% | -57.0% | -38.5% | -59.2% | 2024-12-04 |
| 56 | ROL | Rollins, Inc. | Industrials | Environmental & Facilities Services | 17.3 | 17.6 | 20.3 | -39.3% | -21.8% | -36.5% | -44.5% | -50.5% | -56.7% | -45.1% | -54.7% | 2026-02-11 |
| 57 | CARR | Carrier Global | Industrials | Building Products | 45.1 | 54.8 | 16.8 | +6.1% | -21.8% | -5.8% | -30.3% | -5.1% | -56.7% | -31.7% | -37.6% | 2025-07-25 |
| 58 | APTV | Aptiv | Consumer Discretionary | Automotive Parts & Equipment | 9.2 | 14.0 | 4.3 | -41.9% | -21.5% | -45.5% | -50.1% | -53.1% | -56.4% | -50.1% | -51.9% | 2026-01-09 |
| 59 | DPZ | Domino's | Consumer Discretionary | Restaurants | 10.6 | 15.2 | 14.6 | -21.3% | -21.5% | -17.4% | -33.3% | -32.5% | -56.4% | -35.2% | -43.1% | 2025-05-19 |
| 60 | ACN | Accenture | Information Technology | IT Consulting & Other Services | 159.7 | 154.8 | 11.5 | +0.1% | -21.2% | +7.3% | -31.9% | -11.1% | -56.1% | -34.5% | -68.8% | 2025-02-05 |
| 61 | DOW | Dow Inc. | Materials | Commodity Chemicals | 24.7 | 41.1 | 9.1 | +51.2% | -21.2% | +50.4% | -21.1% | +40.0% | -56.1% | -30.1% | -57.8% | 2024-11-07 |
| 62 | RDDT | Communication Services | Interactive Media & Services | 17.6 | 14.7 | 15.9 | -60.4% | -19.5% | -56.5% | -66.4% | -71.6% | -54.4% | -66.4% | -66.4% | 2025-09-18 | |
| 63 | LDOS | Leidos | Industrials | Diversified Support Services | 18.1 | 23.8 | 10.0 | -19.4% | -19.5% | -23.4% | -26.8% | -30.6% | -54.4% | -28.4% | -50.4% | 2024-11-11 |
| 64 | OTIS | Otis Worldwide | Industrials | Industrial Machinery & Supplies & Components | 29.8 | 36.9 | 14.7 | -8.8% | -18.1% | -13.7% | -22.5% | -20.0% | -53.0% | -24.9% | -38.6% | 2025-04-03 |
| 65 | BKNG | Booking Holdings | Consumer Discretionary | Hotels, Resorts & Cruise Lines | 115.5 | 115.0 | 11.0 | -27.7% | -17.7% | -23.6% | -33.2% | -38.9% | -52.6% | -33.9% | -36.4% | 2025-07-07 |
| 66 | EIX | Edison International | Utilities | Electric Utilities | 23.0 | 66.8 | 8.3 | +5.1% | -17.7% | +13.9% | -24.4% | -6.1% | -52.6% | -32.4% | -45.3% | 2024-11-27 |
| 67 | NFLX | Netflix | Communication Services | Movies & Entertainment | 259.6 | 264.2 | 16.6 | -33.5% | -17.6% | -44.3% | -53.5% | -44.7% | -52.5% | -53.5% | -53.7% | 2025-06-30 |
| 68 | CDW | CDW Corporation | Information Technology | Technology Distributors | 18.8 | 25.3 | 12.6 | +12.3% | -17.3% | -3.6% | -24.7% | +1.1% | -52.2% | -26.9% | -51.8% | 2025-02-05 |
| 69 | WYNN | Wynn Resorts | Consumer Discretionary | Casinos & Gaming | 8.0 | 17.1 | 9.4 | -35.0% | -17.2% | -34.1% | -41.2% | -46.2% | -52.1% | -41.8% | -46.5% | 2025-10-02 |
| 70 | WDAY | Workday, Inc. | Information Technology | Application Software | 47.7 | 48.0 | 30.3 | -7.8% | -17.1% | -17.4% | -29.2% | -18.9% | -52.0% | -29.2% | -59.8% | 2024-12-09 |
| 71 | XYL | Xylem Inc. | Industrials | Industrial Machinery & Supplies & Components | 22.3 | 23.8 | 12.1 | -27.8% | -16.5% | -34.6% | -35.5% | -39.0% | -51.4% | -36.4% | -42.3% | 2025-10-29 |
| 72 | MGM | MGM Resorts | Consumer Discretionary | Casinos & Gaming | 7.7 | 35.6 | 16.7 | -16.2% | -16.1% | -4.6% | -39.7% | -27.4% | -51.0% | -39.7% | -46.2% | 2026-06-01 |
| 73 | KHC | Kraft Heinz | Consumer Staples | Packaged Foods & Meats | 29.6 | 45.3 | 8.2 | +8.1% | -16.0% | +7.7% | -16.0% | -3.1% | -50.9% | -25.6% | -36.7% | 2024-11-05 |
| 74 | SYK | Stryker Corporation | Health Care | Health Care Equipment | 116.8 | 123.3 | 16.4 | -12.0% | -14.7% | -12.9% | -22.9% | -23.2% | -49.6% | -24.0% | -33.1% | 2025-07-25 |
| 75 | TPL | Texas Pacific Land Corporation | Energy | Oil & Gas Exploration & Production | 22.8 | 22.6 | 30.5 | +15.4% | -14.6% | +5.6% | -42.1% | +4.2% | -49.5% | -42.8% | -52.6% | 2024-11-22 |
| 76 | SBAC | SBA Communications | Real Estate | Telecom Tower REITs | 19.6 | 34.8 | 19.0 | -2.5% | -14.3% | -1.0% | -21.4% | -13.7% | -49.2% | -24.1% | -35.1% | 2025-04-30 |
| 77 | HPQ | HP Inc. | Information Technology | Technology Hardware, Storage & Peripherals | 25.6 | 32.1 | 6.9 | +32.5% | -14.3% | +8.0% | -20.9% | +21.3% | -49.2% | -27.7% | -53.7% | 2024-11-25 |
| 78 | AKAM | Akamai Technologies | Information Technology | Internet Services & Infrastructure | 12.5 | 19.3 | 17.9 | -0.6% | -13.8% | +15.4% | -46.2% | -11.8% | -48.7% | -46.2% | -46.2% | 2026-05-13 |
| 79 | ISRG | Intuitive Surgical | Health Care | Health Care Equipment | 154.3 | 145.8 | 32.6 | -22.9% | -13.7% | -18.2% | -28.4% | -34.1% | -48.6% | -28.4% | -45.6% | 2025-01-22 |
| 80 | MAA | Mid-America Apartment Communities | Real Estate | Multi-Family Residential REITs | 13.7 | 19.6 | 15.8 | -10.6% | -13.2% | -3.1% | -25.0% | -21.8% | -48.2% | -30.8% | -33.2% | 2025-03-03 |
| 81 | LOW | Lowe's | Consumer Discretionary | Home Improvement Retail | 122.3 | 156.2 | 12.3 | -7.5% | -13.2% | -6.4% | -22.8% | -18.8% | -48.1% | -24.1% | -37.5% | 2026-02-13 |
| 82 | APO | Apollo Global Management | Financials | Asset Management & Custody Banks | 70.5 | 84.6 | 8.9 | -16.4% | -12.8% | -2.3% | -31.3% | -27.6% | -47.7% | -33.1% | -43.8% | 2024-12-11 |
| 83 | KMB | Kimberly-Clark | Consumer Staples | Household Products | 36.0 | 41.6 | 12.0 | +11.4% | -12.3% | -4.9% | -21.3% | +0.2% | -47.2% | -26.6% | -36.9% | 2025-03-10 |
| 84 | ARES | Ares Management | Financials | Asset Management & Custody Banks | 30.2 | 48.3 | 21.1 | -14.9% | -12.2% | -6.9% | -28.7% | -26.1% | -47.1% | -32.9% | -51.3% | 2025-01-31 |
| 85 | IR | Ingersoll Rand | Industrials | Industrial Machinery & Supplies & Components | 31.8 | 34.4 | 17.0 | +4.5% | -11.8% | +8.5% | -21.3% | -6.7% | -46.7% | -21.5% | -36.6% | 2024-11-25 |
| 86 | BXP | BXP, Inc. | Real Estate | Office REITs | 10.1 | 28.5 | 15.4 | -2.5% | -11.6% | -6.7% | -15.9% | -13.7% | -46.5% | -23.7% | -38.7% | 2024-11-26 |
| 87 | UHS | Universal Health Services | Health Care | Health Care Facilities | 10.6 | 16.5 | 6.2 | -16.9% | -11.2% | -16.4% | -25.7% | -28.1% | -46.1% | -26.0% | -42.2% | 2025-11-26 |
| 88 | ODFL | Old Dominion | Industrials | Cargo Ground Transportation | 36.5 | 35.3 | 18.5 | +12.9% | -11.2% | +26.3% | -29.0% | +1.7% | -46.1% | -29.1% | -45.5% | 2026-06-09 |
| 89 | FSLR | First Solar | Information Technology | Semiconductors | 19.6 | 17.4 | 7.0 | -30.3% | -11.2% | -31.8% | -42.8% | -41.5% | -46.1% | -42.8% | -47.2% | 2026-06-03 |
| 90 | LYB | LyondellBasell | Materials | Specialty Chemicals | 21.6 | 32.8 | 7.7 | +59.6% | -10.9% | +53.1% | -11.7% | +48.4% | -45.8% | -23.4% | -51.6% | 2024-11-07 |
| 91 | OMC | Omnicom Group | Communication Services | Advertising | 23.0 | 30.4 | 7.3 | +7.3% | -10.4% | +16.6% | -13.8% | -3.9% | -45.3% | -20.1% | -36.0% | 2024-11-06 |
| 92 | SW | Smurfit Westrock | Materials | Paper & Plastic Packaging Products & Materials | 22.8 | 35.9 | 8.0 | +15.6% | -10.2% | +21.0% | -18.9% | +4.4% | -45.1% | -23.4% | -42.1% | 2024-11-22 |
| 93 | VICI | Vici Properties | Real Estate | Hotel & Resort REITs | 27.5 | 44.9 | 14.0 | -6.4% | -10.1% | -10.8% | -20.1% | -17.6% | -45.0% | -26.3% | -33.6% | 2025-08-04 |
| 94 | SNPS | Synopsys | Information Technology | Application Software | 89.3 | 96.8 | 46.7 | -0.8% | -10.1% | +2.7% | -27.8% | -12.0% | -45.0% | -27.8% | -43.0% | 2025-07-30 |
| 95 | ADSK | Autodesk | Information Technology | Application Software | 53.9 | 51.7 | 22.6 | -12.9% | -10.0% | -14.4% | -21.1% | -24.1% | -44.9% | -21.1% | -42.6% | 2025-09-08 |
| 96 | PAYX | Paychex | Industrials | Human Resource & Employment Services | 41.1 | 43.6 | 14.2 | +7.5% | -9.9% | +4.1% | -23.2% | -3.7% | -44.9% | -27.7% | -46.5% | 2025-06-06 |
| 97 | ROP | Roper Technologies | Information Technology | Electronic Equipment & Instruments | 47.4 | 55.6 | 16.9 | +8.8% | -9.9% | +8.5% | -18.1% | -2.4% | -44.8% | -19.2% | -46.9% | 2025-03-05 |
| 98 | AOS | A. O. Smith | Industrials | Building Products | 8.8 | 9.0 | 11.4 | +0.1% | -9.4% | +1.4% | -17.2% | -11.1% | -44.3% | -18.7% | -31.2% | 2026-02-10 |
| 99 | CTSH | Cognizant | Information Technology | IT Consulting & Other Services | 29.1 | 29.7 | 7.2 | -20.2% | -9.4% | -8.7% | -25.8% | -31.4% | -44.3% | -28.2% | -57.3% | 2025-02-14 |
| 100 | CCI | Crown Castle | Real Estate | Telecom Tower REITs | 37.0 | 60.6 | 22.9 | +1.8% | -9.3% | +1.4% | -18.8% | -9.4% | -44.2% | -23.6% | -42.0% | 2025-07-24 |
| 101 | PEG | Public Service Enterprise Group | Utilities | Electric Utilities | 37.1 | 61.5 | 13.8 | -5.0% | -9.2% | -4.5% | -16.1% | -16.2% | -44.1% | -21.3% | -29.6% | 2024-11-26 |
| 102 | BR | Broadridge Financial Solutions | Industrials | Data Processing & Outsourced Services | 20.8 | 23.5 | 13.0 | -15.9% | -9.0% | -14.5% | -29.1% | -27.1% | -43.9% | -31.0% | -49.2% | 2025-08-06 |
| 103 | UBER | Uber | Industrials | Passenger Ground Transportation | 136.3 | 143.7 | 19.2 | -18.4% | -8.9% | -30.9% | -33.4% | -29.6% | -43.8% | -33.4% | -34.8% | 2025-10-06 |
| 104 | HD | Home Depot (The) | Consumer Discretionary | Home Improvement Retail | 340.4 | 389.5 | 15.8 | +1.3% | -8.5% | -7.6% | -17.2% | -9.9% | -43.4% | -20.9% | -34.8% | 2024-12-06 |
| 105 | PEP | PepsiCo | Consumer Staples | Soft Drinks & Non-alcoholic Beverages | 191.4 | 228.1 | 11.9 | +0.8% | -8.3% | +0.0% | -15.1% | -10.4% | -43.3% | -17.6% | -27.4% | 2026-02-06 |
| 106 | JKHY | Jack Henry & Associates | Financials | Transaction & Payment Processing Services | 11.5 | 11.4 | 16.2 | -9.4% | -8.2% | +11.4% | -14.2% | -20.6% | -43.1% | -15.2% | -35.9% | 2026-01-14 |
| 107 | GEHC | GE HealthCare | Health Care | Health Care Equipment | 36.0 | 42.5 | 11.8 | -2.8% | -8.2% | +6.3% | -14.6% | -14.0% | -43.1% | -14.9% | -37.1% | 2025-02-13 |
| 108 | AON | Aon plc | Financials | Insurance Brokers | 70.7 | 82.2 | 13.8 | -5.1% | -7.5% | -1.7% | -17.8% | -16.3% | -42.4% | -18.6% | -34.2% | 2025-03-03 |
| 109 | ZBH | Zimmer Biomet | Health Care | Health Care Equipment | 18.6 | 25.2 | 10.0 | +9.1% | -7.4% | -2.2% | -12.6% | -2.1% | -42.3% | -14.0% | -29.7% | 2025-03-31 |
| 110 | INVH | Invitation Homes | Real Estate | Single-Family Residential REITs | 15.6 | 24.0 | 16.2 | -0.1% | -7.3% | -0.2% | -19.3% | -11.2% | -42.2% | -24.3% | -31.2% | 2025-05-02 |
| 111 | UPS | United Parcel Service | Industrials | Air Freight & Logistics | 93.3 | 115.6 | 10.4 | +15.9% | -7.2% | +21.3% | -10.7% | +4.7% | -42.2% | -20.2% | -40.0% | 2024-11-25 |
| 112 | KVUE | Kenvue | Consumer Staples | Personal Care Products | 37.1 | 44.4 | 12.7 | +17.2% | -7.2% | +43.8% | -14.7% | +6.1% | -42.1% | -21.0% | -42.3% | 2025-05-09 |
| 113 | DHR | Danaher Corporation | Health Care | Life Sciences Tools & Services | 160.3 | 185.5 | 22.5 | +0.2% | -6.8% | +6.6% | -7.9% | -11.0% | -41.7% | -9.0% | -35.4% | 2025-01-27 |
| 114 | DHI | D. R. Horton | Consumer Discretionary | Homebuilding | 41.5 | 44.2 | 11.6 | +7.1% | -6.7% | +3.8% | -15.9% | -4.1% | -41.6% | -16.9% | -33.6% | 2025-09-08 |
| 115 | ZBRA | Zebra Technologies | Information Technology | Electronic Equipment & Instruments | 17.1 | 19.9 | 16.8 | +48.7% | -6.1% | +34.1% | -14.2% | +37.5% | -41.0% | -14.2% | -52.7% | 2025-01-23 |
| 116 | MCD | McDonald's | Consumer Discretionary | Restaurants | 188.0 | 236.4 | 15.8 | -11.4% | -5.5% | -8.7% | -20.6% | -22.6% | -40.5% | -22.1% | -32.3% | 2026-02-27 |
| 117 | UDR | UDR, Inc. | Real Estate | Multi-Family Residential REITs | 11.5 | 18.3 | 17.6 | +1.9% | -5.5% | +10.9% | -15.8% | -9.3% | -40.4% | -22.5% | -28.2% | 2024-11-27 |
| 118 | AVY | Avery Dennison | Materials | Paper & Plastic Packaging Products & Materials | 14.2 | 17.2 | 11.5 | +4.6% | -5.3% | +9.4% | -6.2% | -6.6% | -40.2% | -10.1% | -26.4% | 2024-11-25 |
| 119 | ALB | Albemarle Corporation | Materials | Specialty Chemicals | 10.7 | 13.6 | 9.2 | -35.4% | -4.7% | -6.8% | -57.8% | -46.6% | -39.6% | -58.0% | -58.0% | 2026-04-16 |
| 120 | AMT | American Tower | Real Estate | Telecom Tower REITs | 87.3 | 136.8 | 19.3 | +10.5% | -4.1% | +9.5% | -14.9% | -0.7% | -39.0% | -19.0% | -30.7% | 2025-07-22 |
| 121 | MLM | Martin Marietta Materials | Materials | Construction Materials | 39.2 | 38.7 | 18.2 | -10.9% | -3.7% | -9.4% | -21.7% | -22.1% | -38.6% | -22.0% | -33.5% | 2026-02-10 |
| 122 | CPT | Camden Property Trust | Real Estate | Multi-Family Residential REITs | 11.8 | 15.2 | 17.0 | -4.8% | -3.4% | +6.5% | -13.5% | -15.9% | -38.3% | -20.0% | -24.6% | 2024-11-27 |
| 123 | ABT | Abbott Laboratories | Health Care | Health Care Equipment | 190.6 | 211.5 | 17.7 | -9.9% | -3.0% | -8.7% | -18.4% | -21.1% | -37.9% | -21.4% | -41.1% | 2025-03-03 |
| 124 | RMD | ResMed | Health Care | Health Care Equipment | 32.8 | 31.9 | 15.0 | -2.5% | -2.8% | -4.7% | -19.9% | -13.7% | -37.7% | -20.7% | -37.8% | 2025-08-22 |
| 125 | CI | Cigna | Health Care | Health Care Services | 78.0 | 103.7 | 8.1 | +9.1% | -2.8% | +23.5% | -10.3% | -2.1% | -37.7% | -13.9% | -28.8% | 2024-11-11 |
| 126 | MRSH | Marsh McLennan | Financials | Insurance Brokers | 97.7 | 116.1 | 14.7 | +13.1% | -2.7% | +17.8% | -13.3% | +1.9% | -37.6% | -15.9% | -35.6% | 2025-04-03 |
| 127 | TECH | Bio-Techne | Health Care | Life Sciences Tools & Services | 11.4 | 11.4 | 34.2 | +24.1% | -2.4% | +16.8% | -6.8% | +12.9% | -37.3% | -7.7% | -45.0% | 2025-01-21 |
| 128 | GPN | Global Payments | Financials | Transaction & Payment Processing Services | 26.4 | 44.6 | 10.0 | +30.0% | -2.3% | +29.8% | -14.5% | +18.8% | -37.2% | -16.5% | -47.7% | 2024-11-27 |
| 129 | VMRK | Vivmark Residential | Real Estate | Multi-Family Residential REITs | 48.1 | 57.2 | 31.2 | +3.3% | -2.0% | +9.5% | -12.6% | -7.9% | -36.9% | -19.7% | -25.2% | 2024-11-27 |
| 130 | ON | ON Semiconductor | Information Technology | Semiconductors | 27.3 | 28.8 | 13.8 | +29.5% | -1.2% | +40.0% | -47.6% | +18.3% | -36.1% | -47.6% | -56.8% | 2026-06-03 |
| 131 | TDG | TransDigm Group | Industrials | Aerospace & Defense | 67.1 | 94.2 | 18.5 | -8.7% | -0.6% | -7.2% | -20.0% | -19.9% | -35.5% | -25.1% | -33.6% | 2025-07-30 |
| 132 | AXON | Axon Enterprise | Industrials | Aerospace & Defense | 34.6 | 35.9 | 217.5 | -25.1% | -0.1% | -41.9% | -51.1% | -36.3% | -35.0% | -51.1% | -60.3% | 2025-08-07 |
| 133 | IFF | International Flavors & Fragrances | Materials | Specialty Chemicals | 24.1 | 29.5 | 15.4 | +42.7% | -0.1% | +53.6% | -0.2% | +31.5% | -35.0% | -4.5% | -39.9% | 2024-11-05 |
| 134 | SHW | Sherwin-Williams | Materials | Specialty Chemicals | 85.1 | 94.4 | 19.8 | +9.5% | +0.2% | +3.1% | -10.4% | -1.7% | -34.7% | -11.8% | -26.7% | 2024-11-25 |
| 135 | CEG | Constellation Energy | Utilities | Electric Utilities | 91.1 | 117.3 | 14.8 | -26.9% | +0.8% | -31.4% | -36.0% | -38.1% | -34.1% | -36.3% | -50.8% | 2025-10-15 |
| 136 | IRM | Iron Mountain | Real Estate | Other Specialized REITs | 34.3 | 54.8 | 21.5 | +42.0% | +1.4% | +15.6% | -12.8% | +30.8% | -33.5% | -13.4% | -38.8% | 2026-06-23 |
| 137 | DOC | Healthpeak Properties | Real Estate | Health Care REITs | 13.4 | 23.5 | 14.9 | +27.9% | +1.4% | +15.9% | -13.3% | +16.7% | -33.5% | -14.6% | -30.7% | 2026-07-28 |
| 138 | AJG | Arthur J. Gallagher & Co. | Financials | Insurance Brokers | 71.5 | 83.1 | 17.9 | +8.8% | +1.4% | +13.1% | -18.8% | -2.4% | -33.5% | -20.0% | -45.0% | 2025-06-02 |
| 139 | HSY | Hershey Company (The) | Consumer Staples | Packaged Foods & Meats | 34.4 | 38.0 | 12.1 | -3.8% | +1.7% | +4.0% | -26.4% | -15.0% | -33.2% | -27.5% | -33.3% | 2026-02-27 |
| 140 | AMP | Ameriprise Financial | Financials | Asset Management & Custody Banks | 43.8 | 37.1 | — | +3.9% | +2.0% | +12.9% | -10.3% | -7.3% | -32.9% | -12.3% | -26.6% | 2025-01-29 |
| 141 | QCOM | Qualcomm | Information Technology | Semiconductors | 173.1 | 180.0 | 15.0 | -3.8% | +2.4% | -8.5% | -34.8% | -15.0% | -32.5% | -35.4% | -41.2% | 2026-05-29 |
| 142 | SWKS | Skyworks Solutions | Information Technology | Semiconductors | 20.0 | 13.1 | 14.8 | +37.1% | +2.7% | +13.1% | -3.6% | +25.9% | -32.2% | -9.4% | -47.6% | 2025-01-21 |
| 143 | CRH | CRH plc | Materials | Construction Materials | 64.3 | 78.3 | 10.1 | -21.7% | +3.1% | -18.0% | -25.7% | -32.9% | -31.8% | -26.5% | -39.7% | 2026-01-09 |
| 144 | ESS | Essex Property Trust | Real Estate | Multi-Family Residential REITs | 17.1 | 23.7 | 18.5 | +5.5% | +3.3% | +9.7% | -9.6% | -5.7% | -31.6% | -15.4% | -23.6% | 2025-03-03 |
| 145 | MDLZ | Mondelez International | Consumer Staples | Packaged Foods & Meats | 84.0 | 103.0 | 13.7 | +26.5% | +3.4% | +19.6% | -2.1% | +15.3% | -31.5% | -6.2% | -27.2% | 2025-07-22 |
| 146 | ELV | Elevance Health | Health Care | Managed Health Care | 89.7 | 83.8 | 9.6 | +19.7% | +3.8% | +33.0% | -5.9% | +8.5% | -31.2% | -8.6% | -39.3% | 2025-04-03 |
| 147 | PHM | PulteGroup | Consumer Discretionary | Homebuilding | 25.0 | 24.0 | 9.2 | +12.7% | +4.0% | +10.5% | -7.3% | +1.5% | -31.0% | -7.9% | -33.1% | 2026-02-13 |
| 148 | HUBB | Hubbell Incorporated | Industrials | Industrial Machinery & Supplies & Components | 22.9 | 27.3 | 17.0 | -1.5% | +4.5% | -6.6% | -21.8% | -12.7% | -30.4% | -22.2% | -33.1% | 2026-04-23 |
| 149 | TROW | T. Rowe Price | Financials | Asset Management & Custody Banks | 22.6 | 20.5 | 6.7 | +7.5% | +4.5% | +8.7% | -6.1% | -3.7% | -30.4% | -15.1% | -35.6% | 2024-12-05 |
| 150 | PG | Procter & Gamble | Consumer Staples | Personal Care Products | 379.1 | 399.0 | 15.9 | +17.4% | +4.6% | +11.9% | -3.9% | +6.2% | -30.3% | -9.0% | -23.2% | 2024-12-02 |
| 151 | CNC | Centene Corporation | Health Care | Managed Health Care | 32.9 | 25.9 | 5.5 | +61.7% | +4.7% | +88.1% | -6.6% | +50.5% | -30.2% | -6.6% | -61.7% | 2026-10-22 |
| 152 | PGR | Progressive Corporation | Financials | Property & Casualty Insurance | 135.6 | 140.3 | 9.1 | +9.4% | +4.7% | +20.9% | -14.3% | -1.8% | -30.2% | -19.7% | -34.6% | 2025-03-17 |
| 153 | TSN | Tyson Foods | Consumer Staples | Packaged Foods & Meats | 20.1 | 27.4 | 9.9 | -0.1% | +4.7% | +14.9% | -15.5% | -11.3% | -30.2% | -17.0% | -26.6% | 2026-05-04 |
| 154 | PTC | PTC Inc. | Information Technology | Application Software | 21.1 | 22.5 | 17.6 | +11.5% | +5.0% | -2.1% | -10.3% | +0.3% | -29.9% | -10.3% | -48.1% | 2025-08-27 |
| 155 | CBRE | CBRE Group | Real Estate | Real Estate Services | 39.4 | 46.9 | 21.3 | -14.9% | +5.0% | -10.3% | -20.3% | -26.1% | -29.9% | -20.3% | -29.1% | 2026-01-29 |
| 156 | PPG | PPG Industries | Materials | Specialty Chemicals | 27.6 | 32.4 | 11.7 | +24.2% | +5.5% | +31.1% | -3.3% | +13.0% | -29.4% | -5.1% | -27.8% | 2026-02-12 |
| 157 | STE | Steris | Health Care | Health Care Equipment | 22.8 | 23.7 | 14.5 | -7.2% | +5.6% | -0.1% | -12.4% | -18.4% | -29.3% | -13.1% | -25.8% | 2026-01-16 |
| 158 | SPGI | S&P Global | Financials | Financial Exchanges & Data | 137.8 | 151.9 | 18.1 | -3.2% | +5.6%* | +4.0% | -10.0% | -14.4% | -29.3% | -11.0% | -30.7% | 2025-08-14 |
| 159 | DLR | Digital Realty | Real Estate | Data Center REITs | 65.3 | 91.3 | 27.1 | +16.1% | +5.8% | +6.2% | -12.5% | +4.9% | -29.1% | -13.7% | -30.4% | 2026-04-20 |
| 160 | EXR | Extra Space Storage | Real Estate | Self-Storage REITs | 33.0 | 46.6 | 20.1 | +23.9% | +5.9% | +22.3% | -1.2% | +12.7% | -29.0% | -9.7% | -26.7% | 2024-11-27 |
| 161 | PCAR | Paccar | Industrials | Construction Machinery & Heavy Transportation Equipment | 54.1 | 59.5 | 16.4 | -5.4% | +6.1% | +7.0% | -25.5% | -16.6% | -28.8% | -25.7% | -27.0% | 2026-07-28 |
| 162 | T | AT&T | Communication Services | Integrated Telecommunication Services | 144.4 | 332.1 | 7.2 | -9.6% | +6.1% | -9.2% | -23.4% | -20.8% | -28.8% | -27.6% | -30.9% | 2025-09-15 |
| 163 | XYZ | Block, Inc. | Financials | Transaction & Payment Processing Services | 46.3 | 46.2 | 29.8 | +18.4% | +6.8% | +1.5% | -22.1% | +7.2% | -28.1% | -22.1% | -53.0% | 2024-12-04 |
| 164 | AMCR | Amcor | Materials | Paper & Plastic Packaging Products & Materials | 22.6 | 35.9 | 10.2 | +22.8% | +7.0% | +31.6% | 1.9% | +11.6% | -27.9% | -7.9% | -31.0% | 2024-11-29 |
| 165 | MCHP | Microchip Technology | Information Technology | Semiconductors | 41.3 | 47.1 | 31.3 | +21.5% | +7.5% | +25.1% | -25.2% | +10.3% | -27.4% | -26.1% | -52.9% | 2026-05-06 |
| 166 | TRMB | Trimble Inc. | Information Technology | Application Software | 15.3 | 16.4 | 18.6 | -16.0% | +7.6% | -17.4% | -22.8% | -27.2% | -27.3% | -22.8% | -42.7% | 2025-07-25 |
| 167 | APD | Air Products | Materials | Industrial Gases | 70.4 | 90.4 | 19.4 | +31.3% | +7.6% | +33.7% | -2.2% | +20.1% | -27.3% | -6.5% | -31.7% | 2025-02-03 |
| 168 | META | Meta Platforms | Communication Services | Interactive Media & Services | 1551.3 | 1604.5 | 13.8 | -7.8% | +7.7% | -6.1% | -22.9% | -19.0% | -27.2% | -23.2% | -34.2% | 2025-08-12 |
| 169 | PRU | Prudential Financial | Financials | Life & Health Insurance | 40.8 | 60.7 | 11.7 | +8.9% | +7.7% | +19.8% | -0.1% | -2.3% | -27.2% | -8.7% | -29.0% | 2024-11-27 |
| 170 | MAS | Masco | Industrials | Building Products | 16.1 | 18.7 | 12.9 | +33.4% | +7.9% | +31.4% | 0.0% | +22.2% | -27.0% | 0.0% | -28.7% | 2026-11-02 |
| 171 | CHD | Church & Dwight | Consumer Staples | Household Products | 26.1 | 27.2 | 19.6 | +33.0% | +8.1% | +27.6% | -0.5% | +21.8% | -26.8% | -2.4% | -27.9% | 2025-03-10 |
| 172 | OKE | Oneok | Energy | Oil & Gas Storage & Transportation | 58.3 | 98.7 | 12.8 | +30.7% | +8.3% | +45.6% | -13.6% | +19.5% | -26.6% | -21.0% | -45.1% | 2024-11-22 |
| 173 | VMC | Vulcan Materials Company | Materials | Construction Materials | 37.1 | 41.3 | 18.0 | +2.0% | +8.5% | +0.6% | -12.0% | -9.2% | -26.4% | -12.5% | -27.1% | 2026-02-10 |
| 174 | TXT | Textron | Industrials | Aerospace & Defense | 15.0 | 17.1 | 10.1 | +1.6% | +8.9% | +9.7% | -12.1% | -9.6% | -26.0% | -12.2% | -31.1% | 2026-02-20 |
| 175 | ADP | Automatic Data Processing | Industrials | Human Resource & Employment Services | 117.9 | 118.3 | 18.1 | +18.8% | +8.9% | +18.1% | -5.0% | +7.6% | -26.0% | -8.6% | -42.2% | 2025-06-06 |
| 176 | AZO | AutoZone | Consumer Discretionary | Automotive Retail | 52.4 | 63.8 | 14.9 | -4.1% | +9.1% | -11.5% | -25.3% | -15.3% | -25.8% | -25.3% | -35.9% | 2025-09-11 |
| 177 | O | Realty Income | Real Estate | Retail REITs | 54.5 | 87.0 | 16.2 | +6.8% | +9.2% | +4.8% | -11.7% | -4.4% | -25.7% | -14.8% | -21.0% | 2026-03-02 |
| 178 | CL | Colgate-Palmolive | Consumer Staples | Household Products | 77.4 | 82.2 | 16.3 | +26.3% | +9.5% | +29.5% | 0.0% | +15.1% | -25.4% | -1.7% | -23.1% | 2026-02-27 |
| 179 | GEN | Gen Digital | Information Technology | Systems Software | 17.7 | 24.8 | 9.9 | +11.6% | +9.7% | +15.7% | -4.8% | +0.4% | -25.2% | -7.1% | -44.4% | 2025-08-13 |
| 180 | MSI | Motorola Solutions | Information Technology | Communications Equipment | 80.6 | 90.3 | 24.0 | +28.2% | +9.7% | +21.2% | -1.3% | +17.0% | -25.2% | -3.4% | -27.9% | 2024-11-08 |
| 181 | FRT | Federal Realty Investment Trust | Real Estate | Retail REITs | 9.7 | 14.7 | 17.3 | +15.2% | +9.9% | +20.7% | -11.4% | +4.0% | -25.0% | -12.4% | -28.9% | 2026-07-27 |
| 182 | CMS | CMS Energy | Utilities | Multi-Utilities | 22.2 | 42.5 | 13.6 | +3.6% | +10.1% | -0.8% | -10.1% | -7.6% | -24.8% | -11.5% | -21.7% | 2026-04-09 |
| 183 | NWSA | News Corp (Class A) | Communication Services | Publishing | 16.5 | 17.3 | 12.9 | +14.5% | +10.3% | +12.9% | -4.5% | +3.3% | -24.6% | -4.8% | -27.8% | 2026-08-27 |
| 184 | SBUX | Starbucks | Consumer Discretionary | Restaurants | 119.0 | 136.8 | 23.9 | +26.2% | +11.1% | +32.4% | -6.3% | +15.0% | -23.9% | -9.8% | -32.2% | 2025-02-28 |
| 185 | CTAS | Cintas | Industrials | Diversified Support Services | 89.3 | 89.6 | 28.9 | +20.4% | +11.2% | +23.9% | -0.1% | +9.2% | -23.7% | -1.3% | -28.2% | 2025-06-06 |
| 186 | WTW | Willis Towers Watson | Financials | Insurance Brokers | 30.0 | 35.1 | 12.2 | +0.1% | +11.4% | +5.3% | -6.9% | -11.1% | -23.5% | -7.2% | -30.8% | 2026-08-24 |
| 187 | PSA | Public Storage | Real Estate | Self-Storage REITs | 62.3 | 77.8 | 22.1 | +32.3% | +11.6% | +24.6% | 2.8% | +21.1% | -23.3% | -5.2% | -26.4% | 2024-11-27 |
| 188 | HBAN | Huntington Bancshares | Financials | Regional Banks | 32.3 | 41.2 | — | -5.0% | +11.6% | +7.7% | -14.5% | -16.2% | -23.3% | -16.9% | -31.4% | 2026-02-06 |
| 189 | NRG | NRG Energy | Utilities | Independent Power Producers & Energy Traders | 19.9 | 44.1 | 13.6 | -40.0% | +11.7% | -44.3% | -48.2% | -51.2% | -23.2% | -48.6% | -49.8% | 2026-02-24 |
| 190 | TT | Trane Technologies | Industrials | Building Products | 90.5 | 92.8 | 20.6 | +7.0% | +11.7% | -7.2% | -17.7% | -4.2% | -23.2% | -17.9% | -24.8% | 2026-06-25 |
| 191 | NXPI | NXP Semiconductors | Information Technology | Semiconductors | 64.8 | 72.8 | 13.5 | +20.1% | +11.8% | +25.2% | -22.1% | +8.9% | -23.1% | -22.7% | -37.6% | 2026-05-26 |
| 192 | ETN | Eaton Corporation | Industrials | Electrical Components & Equipment | 142.2 | 164.4 | 24.8 | +15.9% | +11.9% | -3.0% | -20.4% | +4.7% | -23.0% | -20.4% | -34.7% | 2026-08-12 |
| 193 | SRE | Sempra | Utilities | Multi-Utilities | 56.2 | 103.5 | 17.6 | -0.4% | +12.0% | -3.7% | -12.5% | -11.6% | -22.9% | -13.8% | -32.7% | 2026-04-09 |
| 194 | BDX | Becton Dickinson | Health Care | Health Care Equipment | 54.1 | 70.0 | 11.4 | +32.7% | +12.4%* | +44.9% | -0.9% | +21.5% | -22.5% | -0.9% | -33.7% | 2026-10-22 |
| 195 | HON | Honeywell Technologies | Industrials | Industrial Conglomerates | 70.9 | 80.6 | 8.9 | +10.8% | +12.6%* | +8.1% | -13.2% | -0.3% | -22.3% | -14.0% | -22.6% | 2026-03-02 |
| 196 | IEX | IDEX Corporation | Industrials | Industrial Machinery & Supplies & Components | 17.4 | 18.4 | 18.4 | +34.8% | +12.7% | +39.8% | -1.4% | +23.6% | -22.2% | -1.7% | -33.3% | 2026-08-12 |
| 197 | MCO | Moody's Corporation | Financials | Financial Exchanges & Data | 87.3 | 91.3 | 22.5 | -0.3% | +12.7% | +6.3% | -5.6% | -11.5% | -22.2% | -6.2% | -24.8% | 2026-01-15 |
| 198 | AES | AES Corporation | Utilities | Independent Power Producers & Energy Traders | 10.6 | 49.6 | 12.2 | +9.0% | +12.8% | +12.7% | -10.6% | -2.2% | -22.1% | -13.8% | -37.9% | 2026-02-27 |
| 199 | EXE | Expand Energy | Energy | Oil & Gas Exploration & Production | 20.7 | 25.5 | 3.8 | -17.5% | +12.9% | -11.4% | -25.9% | -28.7% | -22.0% | -27.2% | -31.6% | 2025-12-03 |
| 200 | NWS | News Corp (Class B) | Communication Services | Publishing | — incl. in NWSA | — incl. in NWSA | — incl. in NWSA | +10.3% | +13.1% | +7.2% | -7.8% | -0.9% | -21.8% | -8.1% | -27.1% | 2026-08-27 |
| 201 | MSCI | MSCI | Financials | Financial Exchanges & Data | 46.3 | 51.2 | 25.4 | +12.3% | +13.2% | +9.8% | -0.7% | +1.1% | -21.7% | -1.0% | -20.4% | 2026-06-01 |
| 202 | NOC | Northrop Grumman | Industrials | Aerospace & Defense | 78.9 | 92.9 | 12.7 | -1.4% | +13.3% | -3.3% | -27.1% | -12.6% | -21.6% | -27.7% | -38.4% | 2026-03-02 |
| 203 | BA | Boeing | Industrials | Aerospace & Defense | 139.0 | 163.8 | 81.4 | -19.2% | +13.5% | -12.8% | -30.4% | -30.4% | -21.4% | -30.4% | -33.7% | 2026-01-23 |
| 204 | TGT | Target Corporation | Consumer Staples | Consumer Staples Merchandise Retail | 72.0 | 83.9 | 9.8 | +66.5% | +13.5% | +77.7% | -6.8% | +55.3% | -21.4% | -6.8% | -46.5% | 2026-08-24 |
| 205 | AIG | American International Group | Financials | Multi-line Insurance | 43.1 | 41.5 | 5.1 | -1.8% | +13.9% | +6.9% | -2.7% | -13.0% | -21.0% | -6.1% | -18.1% | 2025-04-02 |
| 206 | VST | Vistra Corp. | Utilities | Electric Utilities | 45.2 | 69.0 | 10.4 | -16.2% | +13.9% | -28.1% | -37.9% | -27.4% | -21.0% | -38.2% | -48.9% | 2025-09-22 |
| 207 | AWK | American Water Works | Utilities | Water Utilities | 29.4 | 45.0 | 15.2 | +15.3% | +14.0% | +17.9% | 0.8% | +4.1% | -20.9% | -3.0% | -20.3% | 2025-04-03 |
| 208 | SO | Southern Company | Utilities | Electric Utilities | 108.8 | 184.7 | 13.0 | +11.2% | +14.1% | +3.9% | -2.0% | -0.0% | -20.8% | -5.1% | -17.4% | 2025-10-15 |
| 209 | ICE | Intercontinental Exchange | Financials | Financial Exchanges & Data | 96.3 | 117.5 | 16.8 | +7.5% | +14.2% | +19.3% | -7.1% | -3.7% | -20.7% | -8.6% | -34.8% | 2025-08-04 |
| 210 | REG | Regency Centers | Real Estate | Retail REITs | 13.8 | 19.1 | 17.8 | +12.7% | +14.5% | +14.1% | -7.7% | +1.5% | -20.4% | -8.6% | -15.8% | 2026-07-17 |
| 211 | WM | Waste Management | Industrials | Environmental & Facilities Services | 94.5 | 116.0 | 14.7 | +9.6% | +14.6% | +21.0% | -2.3% | -1.6% | -20.3% | -3.6% | -18.7% | 2026-03-09 |
| 212 | REGN | Regeneron Pharmaceuticals | Health Care | Biotechnology | 99.4 | 86.5 | 15.3 | +25.0% | +15.0% | +48.2% | 0.0% | +13.8% | -19.9% | 0.0% | -41.8% | 2026-11-02 |
| 213 | VLTO | Veralto | Industrials | Environmental & Facilities Services | 28.1 | 28.4 | 21.0 | +16.5% | +15.0% | +17.9% | 0.0% | +5.3% | -19.9% | 0.0% | -25.1% | 2026-11-02 |
| 214 | SYY | Sysco | Consumer Staples | Food Distributors | 40.2 | 53.0 | 11.8 | +14.1% | +15.2% | +13.2% | -8.4% | +2.9% | -19.7% | -10.3% | -24.0% | 2026-02-27 |
| 215 | KIM | Kimco Realty | Real Estate | Retail REITs | 16.7 | 24.5 | 18.2 | +27.9% | +15.3% | +27.1% | -3.8% | +16.7% | -19.6% | -5.0% | -27.5% | 2026-07-27 |
| 216 | RJF | Raymond James Financial | Financials | Investment Banking & Brokerage | 31.2 | 20.3 | — | +2.5% | +15.6% | +3.7% | -10.1% | -8.7% | -19.3% | -10.4% | -28.4% | 2026-08-12 |
| 217 | ITW | Illinois Tool Works | Industrials | Industrial Machinery & Supplies & Components | 82.4 | 87.7 | 18.0 | +20.0% | +15.8% | +21.9% | -1.4% | +8.8% | -19.1% | -3.2% | -21.6% | 2026-02-13 |
| 218 | WAT | Waters Corporation | Health Care | Life Sciences Tools & Services | 44.1 | 50.4 | 34.7 | +18.4% | +16.1% | +28.6% | -6.4% | +7.2% | -18.8% | -6.4% | -33.5% | 2026-10-29 |
| 219 | SNA | Snap-on | Industrials | Industrial Machinery & Supplies & Components | 18.9 | 18.0 | 12.8 | +8.0% | +16.5% | +11.8% | -12.4% | -3.2% | -18.4% | -12.9% | -21.3% | 2026-07-28 |
| 220 | DOV | Dover Corporation | Industrials | Industrial Machinery & Supplies & Components | 28.7 | 29.2 | 14.9 | +11.4% | +16.6% | +20.2% | -6.8% | +0.2% | -18.3% | -7.5% | -26.8% | 2026-02-20 |
| 221 | NEE | NextEra Energy | Utilities | Multi-Utilities | 178.3 | 296.8 | 22.1 | +8.2% | +16.6% | +7.5% | -11.8% | -3.0% | -18.3% | -13.1% | -22.9% | 2026-04-30 |
| 222 | LIN | Linde plc | Materials | Industrial Gases | 238.6 | 260.4 | 18.8 | +23.1% | +16.7% | +25.9% | -4.6% | +11.9% | -18.2% | -4.9% | -19.5% | 2026-07-02 |
| 223 | EQIX | Equinix | Real Estate | Data Center REITs | 98.4 | 124.4 | 26.5 | +31.7% | +16.7% | +20.0% | -10.5% | +20.5% | -18.2% | -10.9% | -26.3% | 2026-06-22 |
| 224 | CDNS | Cadence Design Systems | Information Technology | Application Software | 90.4 | 91.2 | 41.1 | +5.4% | +16.8% | -2.7% | -20.9% | -5.8% | -18.1% | -20.9% | -34.2% | 2026-06-02 |
| 225 | LHX | L3Harris | Industrials | Aerospace & Defense | 51.9 | 61.6 | 14.5 | -3.8% | +16.9% | -1.9% | -25.4% | -15.0% | -18.1% | -26.3% | -38.3% | 2026-03-02 |
| 226 | SMCI | Supermicro | Information Technology | Technology Hardware, Storage & Peripherals | 20.0 | 27.6 | 9.8 | +4.0% | +16.9% | -41.4% | -49.9% | -7.2% | -18.1% | -49.9% | -66.2% | 2025-07-30 |
| 227 | SOLV | Solventum | Health Care | Health Care Technology | 14.4 | 18.7 | 16.4 | +7.0% | +17.0% | +22.8% | -8.3% | -4.2% | -17.9% | -8.3% | -27.5% | 2026-09-03 |
| 228 | BBY | Best Buy | Consumer Discretionary | Computer & Electronics Retail | 20.2 | 21.8 | 8.3 | +49.3% | +17.1% | +23.3% | -4.2% | +38.1% | -17.8% | -4.2% | -40.3% | 2026-10-29 |
| 229 | TTWO | Take-Two Interactive | Communication Services | Interactive Home Entertainment | 35.9 | 36.7 | 47.8 | -25.0% | +17.3% | -25.1% | -26.8% | -36.2% | -17.6% | -26.8% | -27.7% | 2025-10-20 |
| 230 | GPC | Genuine Parts Company | Consumer Discretionary | Distributors | 17.2 | 22.7 | 11.0 | +4.2% | +17.3% | +1.4% | -14.2% | -7.0% | -17.6% | -16.5% | -38.0% | 2026-02-11 |
| 231 | VRTX | Vertex Pharmaceuticals | Health Care | Biotechnology | 140.2 | 135.8 | 26.6 | +22.0% | +17.4% | +30.0% | -1.0% | +10.8% | -17.5% | -1.0% | -29.1% | 2026-10-30 |
| 232 | MDT | Medtronic | Health Care | Health Care Equipment | 127.0 | 143.4 | 13.8 | +6.0% | +17.6% | +13.1% | -2.6% | -5.2% | -17.3% | -5.8% | -30.0% | 2025-11-25 |
| 233 | J | Jacobs Solutions | Industrials | Construction & Engineering | 18.8 | 21.0 | 19.8 | +22.0% | +18.0% | +3.9% | -1.5% | +10.8% | -16.9% | -2.5% | -34.8% | 2025-10-21 |
| 234 | PKG | Packaging Corporation of America | Materials | Paper & Plastic Packaging Products & Materials | 23.0 | 26.6 | 13.4 | +27.8% | +18.1% | +35.5% | 0.0% | +16.6% | -16.8% | 0.0% | -29.3% | 2026-11-02 |
| 235 | ORLY | O'Reilly Automotive | Consumer Discretionary | Automotive Retail | 73.0 | 81.0 | 18.8 | -0.6% | +18.7% | -4.0% | -15.9% | -11.8% | -16.2% | -15.9% | -23.3% | 2025-09-11 |
| 236 | BALL | Ball Corporation | Materials | Metal, Glass & Plastic Containers | 18.0 | 24.7 | 11.9 | +29.8% | +18.7% | +46.9% | 0.0% | +18.6% | -16.2% | 0.0% | -28.5% | 2026-11-02 |
| 237 | KDP | Keurig Dr Pepper | Consumer Staples | Soft Drinks & Non-alcoholic Beverages | 50.1 | 89.4 | 18.6 | +35.6% | +19.3% | +39.9% | 0.0% | +24.4% | -15.6% | 0.0% | -29.1% | 2026-11-02 |
| 238 | FANG | Diamondback Energy | Energy | Oil & Gas Exploration & Production | 55.9 | 77.6 | 6.6 | +35.1% | +19.4% | +42.9% | -5.5% | +23.9% | -15.5% | -6.5% | -35.6% | 2026-05-04 |
| 239 | GNRC | Generac | Industrials | Heavy Electrical Equipment | 11.9 | 12.8 | 18.2 | +48.2% | +19.6% | +20.2% | -31.6% | +37.0% | -15.3% | -31.6% | -47.8% | 2026-06-22 |
| 240 | ACGL | Arch Capital Group | Financials | Property & Casualty Insurance | 35.7 | 35.2 | 6.7 | +14.0% | +19.7% | +26.6% | 0.0% | +2.8% | -15.2% | 0.0% | -16.8% | 2026-11-02 |
| 241 | DTE | DTE Energy | Utilities | Multi-Utilities | 28.3 | 56.0 | 15.5 | +8.0% | +19.8% | +3.7% | -11.2% | -3.2% | -15.1% | -12.0% | -21.8% | 2026-06-26 |
| 242 | ES | Eversource Energy | Utilities | Electric Utilities | 26.2 | 54.0 | 10.9 | +6.9% | +19.9% | -1.4% | -5.6% | -4.3% | -15.0% | -8.7% | -17.0% | 2026-02-27 |
| 243 | COST | Costco | Consumer Staples | Consumer Staples Merchandise Retail | 461.1 | 437.5 | 30.8 | +21.4% | +19.9% | +14.8% | -4.6% | +10.2% | -15.0% | -4.9% | -21.1% | 2026-05-19 |
| 244 | DXCM | Dexcom | Health Care | Health Care Equipment | 31.6 | 30.3 | 20.2 | +27.7% | +20.5% | +45.6% | -8.2% | +16.5% | -14.4% | -8.2% | -39.6% | 2026-08-21 |
| 245 | DIS | Walt Disney Company (The) | Communication Services | Movies & Entertainment | 195.3 | 239.2 | 11.4 | +0.2% | +20.8% | +1.9% | -7.5% | -11.0% | -14.1% | -8.8% | -30.5% | 2025-06-30 |
| 246 | BG | Bunge Global | Consumer Staples | Agricultural Products & Services | 18.1 | 38.0 | 10.9 | +7.7% | +21.1% | +2.1% | -27.9% | -3.5% | -13.8% | -28.3% | -28.3% | 2026-06-03 |
| 247 | PPL | PPL Corporation | Utilities | Electric Utilities | 27.2 | 46.9 | 12.5 | +5.7% | +22.0% | +2.2% | -7.7% | -5.5% | -12.9% | -9.2% | -19.7% | 2026-04-09 |
| 248 | DASH | DoorDash | Consumer Discretionary | Specialized Consumer Services | 82.9 | 75.4 | 44.1 | -16.1% | +22.1% | -25.3% | -32.5% | -27.3% | -12.8% | -32.5% | -48.0% | 2025-10-06 |
| 249 | PLD | Prologis | Real Estate | Industrial REITs | 123.2 | 161.3 | 23.4 | +3.9% | +22.2% | +7.8% | -12.9% | -7.3% | -12.7% | -13.6% | -27.6% | 2026-07-16 |
| 250 | DUK | Duke Energy | Utilities | Electric Utilities | 100.1 | 193.9 | 11.7 | +12.4% | +22.3% | +6.9% | -2.1% | +1.2% | -12.6% | -3.8% | -15.2% | 2026-03-16 |
| 251 | AXP | American Express | Financials | Consumer Finance | 219.9 | 230.5 | — | -10.3% | +22.9% | -8.1% | -13.8% | -21.5% | -12.0% | -14.8% | -29.0% | 2025-12-11 |
| 252 | BRK.B | Berkshire Hathaway | Financials | Multi-Sector Holdings | 1190.5 | -233.9 | -1.8 | +10.6% | +23.0% | +16.4% | 0.0% | -0.6% | -11.9% | 0.0% | -14.9% | 2026-11-02 |
| 253 | HSIC | Henry Schein | Health Care | Health Care Distributors | 9.7 | 14.7 | 13.6 | +14.6% | +23.1% | +37.1% | -4.7% | +3.4% | -11.8% | -4.7% | -24.3% | 2026-09-03 |
| 254 | EG | Everest Group | Financials | Reinsurance | 15.5 | 14.8 | — | +25.3% | +23.2% | +35.2% | 0.0% | +14.1% | -11.7% | 0.0% | -21.8% | 2026-11-02 |
| 255 | TMO | Thermo Fisher Scientific | Health Care | Life Sciences Tools & Services | 252.9 | 293.7 | 24.2 | +18.1% | +23.2% | +20.7% | -3.7% | +6.9% | -11.7% | -3.7% | -35.7% | 2026-10-29 |
| 256 | BLK | BlackRock | Financials | Asset Management & Custody Banks | 180.8 | 185.5 | 15.4 | +10.8% | +23.5% | +10.1% | -0.9% | -0.4% | -11.4% | -3.0% | -24.1% | 2025-10-15 |
| 257 | MTB | M&T Bank | Financials | Regional Banks | 32.3 | 38.6 | — | +13.7% | +23.5% | +25.6% | -11.1% | +2.5% | -11.4% | -11.7% | -29.4% | 2026-08-14 |
| 258 | IQV | IQVIA | Health Care | Life Sciences Tools & Services | 42.6 | 58.1 | 18.6 | +14.7% | +23.6% | +19.4% | -7.5% | +3.5% | -11.3% | -7.5% | -38.1% | 2026-10-23 |
| 259 | FE | FirstEnergy | Utilities | Electric Utilities | 27.6 | 58.7 | 11.4 | +9.6% | +23.8% | +8.1% | -6.4% | -1.6% | -11.1% | -8.2% | -17.1% | 2026-04-09 |
| 260 | YUM | Yum! Brands | Consumer Discretionary | Restaurants | 43.0 | 55.1 | 18.0 | +5.7% | +23.8% | +16.2% | -5.3% | -5.5% | -11.1% | -6.3% | -19.3% | 2026-02-27 |
| 261 | AFL | Aflac | Financials | Life & Health Insurance | 62.5 | 69.4 | 11.4 | +14.8% | +24.1% | +18.7% | -3.3% | +3.6% | -10.8% | -3.8% | -14.2% | 2026-07-28 |
| 262 | BAC | Bank of America | Financials | Diversified Banks | 342.0 | 308.6 | — | -8.4% | +24.1% | -5.3% | -23.1% | -19.6% | -10.8% | -23.5% | -28.0% | 2026-08-12 |
| 263 | AMZN | Amazon | Consumer Discretionary | Broadline Retail | 2656.0 | 2789.6 | 15.2 | +6.4% | +24.1% | +0.6% | -13.5% | -4.8% | -10.8% | -13.5% | -30.9% | 2026-08-03 |
| 264 | CPAY | Corpay | Financials | Transaction & Payment Processing Services | 26.9 | 34.2 | 12.2 | +36.0% | +24.1% | +57.2% | -3.8% | +24.8% | -10.8% | -3.8% | -34.5% | 2026-08-13 |
| 265 | VZ | Verizon | Communication Services | Integrated Telecommunication Services | 186.7 | 377.5 | 7.2 | +18.0% | +24.2% | +20.9% | -11.1% | +6.8% | -10.7% | -12.4% | -19.1% | 2026-09-15 |
| 266 | LMT | Lockheed Martin | Industrials | Aerospace & Defense | 148.6 | 161.7 | 16.4 | +35.4% | +24.4% | +34.1% | -3.7% | +24.2% | -10.5% | -5.0% | -28.0% | 2026-03-02 |
| 267 | SWK | Stanley Black & Decker | Industrials | Industrial Machinery & Supplies & Components | 16.1 | 20.2 | 11.3 | +48.1% | +24.4% | +64.3% | 0.0% | +36.9% | -10.5% | 0.0% | -42.2% | 2026-11-02 |
| 268 | MTD | Mettler Toledo | Health Care | Life Sciences Tools & Services | 33.6 | 35.6 | 27.9 | +20.4% | +25.0% | +18.5% | -2.4% | +9.2% | -9.9% | -2.4% | -31.9% | 2026-10-29 |
| 269 | PFE | Pfizer | Health Care | Pharmaceuticals | 174.8 | 226.0 | 8.9 | +29.5% | +25.0% | +33.1% | 0.0% | +18.3% | -9.9% | 0.0% | -22.9% | 2026-11-02 |
| 270 | ABNB | Airbnb | Consumer Discretionary | Hotels, Resorts & Cruise Lines | 100.9 | 87.3 | 31.6 | +26.1% | +25.4% | +35.2% | -10.2% | +14.9% | -9.5% | -10.2% | -34.5% | 2026-08-25 |
| 271 | D | Dominion Energy | Utilities | Multi-Utilities | 59.6 | 119.6 | 13.5 | +19.2% | +25.4% | +20.3% | -4.6% | +8.0% | -9.5% | -5.5% | -16.8% | 2026-07-16 |
| 272 | FTV | Fortive | Industrials | Industrial Machinery & Supplies & Components | 19.9 | 22.6 | 17.2 | +21.5% | +25.4%* | +33.4% | 0.0% | +10.3% | -9.5% | 0.0% | -25.6% | 2026-11-02 |
| 273 | MSFT | Microsoft | Information Technology | Systems Software | 3766.0 | 3945.2 | 19.2 | +5.5% | +25.5% | -1.3% | -6.7% | -5.7% | -9.4% | -6.7% | -34.9% | 2026-10-13 |
| 274 | RVTY | Revvity | Health Care | Health Care Equipment | 16.9 | 19.8 | 22.7 | +57.1% | +25.9% | +62.4% | -8.6% | +45.9% | -9.0% | -8.6% | -35.1% | 2026-10-29 |
| 275 | SJM | J.M. Smucker Company (The) | Consumer Staples | Packaged Foods & Meats | 14.0 | 20.8 | 9.2 | +38.4% | +26.0% | +32.1% | -1.5% | +27.2% | -8.9% | -1.5% | -25.4% | 2026-10-22 |
| 276 | JBHT | J.B. Hunt | Industrials | Cargo Ground Transportation | 21.0 | 22.1 | 13.1 | +15.8% | +26.1% | +33.6% | -24.9% | +4.6% | -8.8% | -25.0% | -36.8% | 2026-07-16 |
| 277 | KR | Kroger | Consumer Staples | Food Retail | 40.4 | 61.9 | 7.7 | +11.3% | +26.1% | +9.9% | -8.5% | +0.1% | -8.8% | -9.6% | -26.6% | 2026-03-13 |
| 278 | FERG | Ferguson Enterprises | Industrials | Trading Companies & Distributors | 46.8 | 52.6 | 17.1 | +10.4% | +26.4% | -1.1% | -8.9% | -0.8% | -8.5% | -9.5% | -33.6% | 2026-04-30 |
| 279 | RSG | Republic Services | Industrials | Environmental & Facilities Services | 74.9 | 88.5 | 16.5 | +17.5% | +26.7% | +19.5% | -3.0% | +6.3% | -8.2% | -4.7% | -23.4% | 2025-06-02 |
| 280 | ED | Consolidated Edison | Utilities | Multi-Utilities | 43.8 | 70.0 | 11.4 | +22.2% | +26.7% | +25.7% | 0.0% | +11.0% | -8.2% | 0.0% | -15.8% | 2026-11-02 |
| 281 | XEL | Xcel Energy | Utilities | Multi-Utilities | 50.9 | 91.5 | 14.4 | +9.9% | +26.7% | +0.8% | -3.3% | -1.3% | -8.2% | -5.5% | -17.3% | 2026-02-24 |
| 282 | GWW | W. W. Grainger | Industrials | Industrial Machinery & Supplies & Components | 64.9 | 66.6 | 20.7 | +37.3% | +26.7% | +41.9% | -1.6% | +26.1% | -8.2% | -1.7% | -24.8% | 2026-07-16 |
| 283 | BMY | Bristol Myers Squibb | Health Care | Pharmaceuticals | 128.8 | 159.9 | 8.8 | +22.0% | +27.2% | +42.9% | -6.5% | +10.8% | -7.7% | -7.5% | -32.5% | 2026-09-03 |
| 284 | HIG | Hartford (The) | Financials | Property & Casualty Insurance | 36.2 | 35.6 | 6.0 | -0.3% | +27.4% | +11.1% | -6.6% | -11.5% | -7.5% | -7.0% | -16.0% | 2026-07-29 |
| 285 | OXY | Occidental Petroleum | Energy | Oil & Gas Exploration & Production | 60.7 | 83.4 | 6.1 | +49.7% | +27.5% | +50.3% | -7.5% | +38.5% | -7.4% | -8.3% | -31.5% | 2026-03-30 |
| 286 | A | Agilent Technologies | Health Care | Life Sciences Tools & Services | 48.5 | 51.7 | 24.9 | +27.4% | +27.6% | +18.4% | -5.2% | +16.2% | -7.3% | -5.2% | -34.9% | 2026-10-28 |
| 287 | IBM | IBM | Information Technology | IT Consulting & Other Services | 238.7 | 300.4 | 18.1 | -13.0% | +27.9% | -15.7% | -22.8% | -24.2% | -7.0% | -23.3% | -37.5% | 2026-06-02 |
| 288 | TFC | Truist Financial | Financials | Diversified Banks | 60.1 | 77.6 | — | +5.1% | +28.2% | +17.2% | -7.3% | -6.1% | -6.7% | -10.1% | -27.8% | 2026-02-06 |
| 289 | SCHW | Charles Schwab Corporation | Financials | Investment Banking & Brokerage | 153.4 | 123.7 | — | -10.3% | +28.3% | -5.0% | -21.9% | -21.5% | -6.6% | -21.9% | -22.5% | 2026-08-24 |
| 290 | TJX | TJX Companies | Consumer Discretionary | Apparel Retail | 155.1 | 162.7 | 18.3 | -7.4% | +28.6% | +1.8% | -16.0% | -18.6% | -6.3% | -16.3% | -27.1% | 2026-06-12 |
| 291 | ECL | Ecolab | Materials | Specialty Chemicals | 86.5 | 98.2 | 22.9 | +18.4% | +28.8% | +21.6% | 0.0% | +7.2% | -6.2% | 0.0% | -20.3% | 2026-11-02 |
| 292 | WST | West Pharmaceutical Services | Health Care | Health Care Supplies | 28.4 | 28.6 | 29.7 | +48.6% | +29.7% | +45.0% | -2.1% | +37.4% | -5.2% | -2.1% | -45.3% | 2026-10-29 |
| 293 | WEC | WEC Energy Group | Utilities | Electric Utilities | 38.5 | 61.7 | 15.1 | +13.7% | +30.9% | +8.2% | -0.8% | +2.5% | -4.0% | -1.6% | -15.2% | 2026-06-26 |
| 294 | EXC | Exelon | Utilities | Electric Utilities | 48.1 | 99.4 | 11.9 | +9.5% | +31.0% | +4.4% | -5.9% | -1.7% | -3.9% | -7.6% | -20.1% | 2026-03-16 |
| 295 | MA | Mastercard | Financials | Transaction & Payment Processing Services | 573.3 | 569.3 | 24.7 | +16.0% | +31.1% | +20.0% | 0.0% | +4.8% | -3.8% | 0.0% | -21.3% | 2026-11-02 |
| 296 | HAL | Halliburton | Energy | Oil & Gas Equipment & Services | 28.6 | 36.3 | 8.8 | +24.2% | +31.2% | +31.6% | -18.8% | +13.0% | -3.7% | -19.5% | -39.8% | 2026-05-19 |
| 297 | CHRW | C.H. Robinson | Industrials | Air Freight & Logistics | 14.9 | 16.4 | 16.4 | -19.0% | +31.4% | -15.1% | -38.3% | -30.2% | -3.5% | -38.5% | -40.5% | 2026-07-21 |
| 298 | ATO | Atmos Energy | Utilities | Gas Utilities | 29.5 | 38.9 | 14.8 | +6.0% | +32.0% | +4.1% | -8.1% | -5.2% | -2.9% | -9.2% | -18.8% | 2026-04-09 |
| 299 | COF | Capital One | Financials | Consumer Finance | 129.3 | 128.5 | — | -12.0% | +32.2% | -2.7% | -17.3% | -23.2% | -2.7% | -18.3% | -31.7% | 2026-01-06 |
| 300 | GD | General Dynamics | Industrials | Aerospace & Defense | 100.9 | 105.2 | 15.4 | +12.9% | +32.4% | +10.2% | -5.2% | +1.7% | -2.5% | -5.7% | -23.0% | 2026-08-10 |
| 301 | PNC | PNC Financial Services | Financials | Diversified Banks | 92.0 | 163.8 | — | +14.6% | +32.6% | +31.1% | -9.0% | +3.4% | -2.3% | -9.8% | -30.3% | 2026-08-14 |
| 302 | HCA | HCA Healthcare | Health Care | Health Care Facilities | 97.7 | 153.7 | 9.7 | +0.7% | +32.9% | +2.5% | -13.7% | -10.5% | -2.0% | -14.2% | -33.7% | 2026-03-09 |
| 303 | RF | Regions Financial Corporation | Financials | Regional Banks | 24.7 | 25.9 | — | +10.1% | +33.3% | +24.6% | -9.7% | -1.1% | -1.6% | -10.6% | -33.2% | 2026-07-16 |
| 304 | PNW | Pinnacle West Capital | Utilities | Multi-Utilities | 12.8 | 29.4 | 13.7 | +22.8% | +33.5% | +24.3% | -2.2% | +11.6% | -1.4% | -3.1% | -16.7% | 2026-07-02 |
| 305 | DVN | Devon Energy | Energy | Oil & Gas Exploration & Production | 53.5 | 68.3 | 7.7 | +35.3% | +33.8% | +53.5% | -6.8% | +24.1% | -1.1% | -6.8% | -33.0% | 2026-10-30 |
| 306 | LNT | Alliant Energy | Utilities | Electric Utilities | 18.9 | 31.1 | 16.5 | +15.8% | +34.7% | +12.7% | -5.0% | +4.6% | -0.2% | -6.4% | -19.0% | 2026-07-02 |
| 307 | NDSN | Nordson Corporation | Industrials | Industrial Machinery & Supplies & Components | 18.2 | 19.7 | 20.5 | +37.5% | +35.2% | +43.0% | -1.8% | +26.3% | +0.3% | -2.1% | -36.6% | 2026-08-20 |
| 308 | CB | Chubb Limited | Financials | Property & Casualty Insurance | 141.0 | 162.2 | 11.5 | +19.3% | +35.5% | +34.5% | 0.0% | +8.1% | +0.6% | 0.0% | -12.1% | 2026-11-02 |
| 309 | UAL | United Airlines Holdings | Industrials | Passenger Airlines | 35.5 | 53.5 | 7.6 | -2.3% | +35.8% | +16.2% | -19.7% | -13.5% | +0.9% | -19.7% | -49.2% | 2026-06-26 |
| 310 | MET | MetLife | Financials | Life & Health Insurance | 64.1 | 87.1 | 14.4 | +30.6% | +36.2% | +30.1% | -2.5% | +19.4% | +1.3% | -2.5% | -23.3% | 2026-10-22 |
| 311 | KEY | KeyCorp | Financials | Regional Banks | 22.7 | 38.6 | — | +7.2% | +36.4% | +27.2% | -9.6% | -4.0% | +1.5% | -10.4% | -33.8% | 2026-07-16 |
| 312 | FITB | Fifth Third Bancorp | Financials | Regional Banks | 49.9 | 63.4 | — | +20.3% | +36.5% | +36.5% | -6.6% | +9.1% | +1.6% | -7.4% | -31.2% | 2026-07-16 |
| 313 | CINF | Cincinnati Financial | Financials | Property & Casualty Insurance | 28.2 | 27.3 | 7.8 | +14.5% | +36.8% | +21.6% | -3.8% | +3.3% | +1.8% | -4.3% | -20.9% | 2026-07-02 |
| 314 | WRB | W. R. Berkley Corporation | Financials | Property & Casualty Insurance | 27.9 | 27.9 | 11.1 | +8.4% | +37.1% | +8.3% | -1.5% | -2.8% | +2.2% | -4.2% | -19.0% | 2025-10-14 |
| 315 | USB | U.S. Bancorp | Financials | Diversified Banks | 94.2 | 123.4 | — | +16.6% | +37.2% | +34.6% | -6.7% | +5.4% | +2.3% | -7.5% | -32.2% | 2026-08-14 |
| 316 | AME | Ametek | Industrials | Electrical Components & Equipment | 55.5 | 57.1 | 22.8 | +18.4% | +37.3% | +20.4% | -6.3% | +7.2% | +2.4% | -6.4% | -23.3% | 2026-08-12 |
| 317 | NI | NiSource | Utilities | Multi-Utilities | 21.5 | 42.0 | 13.5 | +10.3% | +37.3% | +9.4% | -7.4% | -0.9% | +2.4% | -8.6% | -20.5% | 2026-06-26 |
| 318 | AEE | Ameren | Utilities | Multi-Utilities | 30.8 | 52.5 | 13.4 | +13.9% | +37.4% | +12.3% | -5.2% | +2.7% | +2.5% | -5.8% | -16.2% | 2026-06-26 |
| 319 | UNP | Union Pacific Corporation | Industrials | Rail Transportation | 182.4 | 208.7 | 15.7 | +34.7% | +37.9% | +42.2% | -0.7% | +23.5% | +3.0% | -1.2% | -18.1% | 2026-08-26 |
| 320 | EW | Edwards Lifesciences | Health Care | Health Care Equipment | 53.8 | 49.6 | 24.8 | +9.4% | +38.1% | +13.1% | -2.0% | -1.8% | +3.2% | -2.0% | -13.2% | 2026-07-06 |
| 321 | WFC | Wells Fargo | Financials | Diversified Banks | 257.8 | 271.6 | — | -6.3% | +38.7% | +0.9% | -9.4% | -17.5% | +3.8% | -10.9% | -25.1% | 2026-01-06 |
| 322 | SLB | Schlumberger | Energy | Oil & Gas Equipment & Services | 77.2 | 89.7 | 12.1 | +38.5% | +38.8% | +48.6% | -12.5% | +27.3% | +3.9% | -13.0% | -28.4% | 2026-08-31 |
| 323 | F | Ford Motor Company | Consumer Discretionary | Automobile Manufacturers | 50.3 | 189.3 | 24.2 | -0.6% | +38.9% | +0.4% | -27.0% | -11.8% | +4.0% | -27.8% | -33.6% | 2026-05-29 |
| 324 | CCL | Carnival Corporation | Consumer Discretionary | Hotels, Resorts & Cruise Lines | 40.4 | 62.7 | 8.6 | -0.0% | +39.4% | +5.9% | -10.2% | -11.2% | +4.5% | -11.6% | -42.3% | 2026-02-06 |
| 325 | EOG | EOG Resources | Energy | Oil & Gas Exploration & Production | 82.8 | 90.2 | 6.2 | +55.1% | +39.5% | +53.9% | -4.6% | +43.9% | +4.6% | -4.6% | -26.3% | 2026-10-30 |
| 326 | FFIV | F5, Inc. | Information Technology | Communications Equipment | 18.4 | 17.8 | 19.3 | +27.1% | +39.8% | +28.3% | -32.4% | +15.9% | +4.9% | -32.4% | -34.7% | 2026-10-09 |
| 327 | APP | AppLovin | Communication Services | Advertising | 76.9 | 76.9 | 14.2 | -66.0% | +39.9% | -64.1% | -68.8% | -77.2% | +5.0% | -68.8% | -68.8% | 2025-12-22 |
| 328 | FAST | Fastenal | Industrials | Trading Companies & Distributors | 60.3 | 59.8 | 29.3 | +33.8% | +40.2% | +30.5% | 0.2% | +22.6% | +5.2% | -0.3% | -22.3% | 2026-10-22 |
| 329 | ALLE | Allegion | Industrials | Building Products | 16.3 | 17.6 | 16.0 | +21.8% | +40.3% | +17.0% | 0.0% | +10.6% | +5.4% | 0.0% | -30.1% | 2026-11-02 |
| 330 | L | Loews Corporation | Financials | Multi-line Insurance | 22.8 | 26.2 | 8.1 | +5.9% | +41.2% | +12.1% | -6.7% | -5.3% | +6.3% | -6.8% | -12.5% | 2026-07-28 |
| 331 | FCX | Freeport-McMoRan | Materials | Copper | 90.4 | 106.1 | 10.7 | +25.1% | +41.5% | +52.4% | -21.0% | +13.9% | +6.6% | -21.2% | -40.0% | 2026-08-25 |
| 332 | DD | DuPont | Industrials | Industrial Conglomerates | 19.1 | 20.5 | 12.9 | +18.6% | +41.8%* | +40.3% | -7.5% | +7.4% | +6.9% | -8.6% | -36.3% | 2026-02-11 |
| 333 | VTR | Ventas | Real Estate | Health Care REITs | 45.9 | 57.9 | 23.5 | +14.1% | +42.5% | +20.4% | -13.2% | +2.9% | +7.6% | -13.7% | -20.4% | 2026-07-24 |
| 334 | GRMN | Garmin | Consumer Discretionary | Consumer Electronics | 52.9 | 50.4 | 20.9 | +36.9% | +42.9% | +30.3% | -12.1% | +25.7% | +8.0% | -12.4% | -28.2% | 2026-08-10 |
| 335 | NSC | Norfolk Southern | Industrials | Rail Transportation | 77.6 | 92.5 | 16.0 | +21.3% | +43.0% | +24.1% | -2.1% | +10.1% | +8.1% | -2.1% | -25.5% | 2026-08-24 |
| 336 | AEP | American Electric Power | Utilities | Electric Utilities | 71.0 | 126.6 | 13.4 | +15.6% | +43.2% | +11.7% | -5.3% | +4.4% | +8.3% | -6.0% | -15.2% | 2026-06-26 |
| 337 | BIIB | Biogen | Health Care | Biotechnology | 36.8 | 44.0 | 13.3 | +41.5% | +43.3% | +61.4% | -1.9% | +30.3% | +8.4% | -1.9% | -35.9% | 2026-10-22 |
| 338 | SYF | Synchrony Financial | Financials | Consumer Finance | 25.0 | 26.3 | — | -6.8% | +43.9% | +5.0% | -12.1% | -18.0% | +9.0% | -13.2% | -38.0% | 2026-01-06 |
| 339 | VEEV | Veeva Systems | Health Care | Health Care Technology | 49.7 | 43.6 | 40.5 | +37.5% | +44.3% | +5.4% | -5.0% | +26.3% | +9.4% | -5.0% | -50.5% | 2026-10-23 |
| 340 | TDY | Teledyne Technologies | Information Technology | Electronic Equipment & Instruments | 30.6 | 31.8 | 19.2 | +29.2% | +45.0% | +25.3% | -4.5% | +18.0% | +10.1% | -4.5% | -18.4% | 2026-08-07 |
| 341 | COP | ConocoPhillips | Energy | Oil & Gas Exploration & Production | 178.9 | 200.6 | 7.5 | +60.3% | +45.0% | +70.5% | -4.7% | +49.1% | +10.1% | -4.7% | -27.3% | 2026-10-30 |
| 342 | SPG | Simon Property Group | Real Estate | Retail REITs | 71.7 | 100.3 | 19.6 | +23.8% | +45.2% | +32.0% | -5.3% | +12.6% | +10.3% | -6.3% | -25.2% | 2026-07-28 |
| 343 | KMI | Kinder Morgan | Energy | Oil & Gas Storage & Transportation | 72.9 | 109.2 | 14.2 | +22.4% | +45.3% | +29.9% | -5.0% | +11.2% | +10.4% | -5.0% | -19.2% | 2026-10-23 |
| 344 | BKR | Baker Hughes | Energy | Oil & Gas Equipment & Services | 52.7 | 68.2 | 13.6 | +17.8% | +45.5% | +11.3% | -23.3% | +6.6% | +10.6% | -23.9% | -28.4% | 2026-04-30 |
| 345 | MMM | 3M | Industrials | Industrial Conglomerates | 92.0 | 99.3 | 15.3 | +13.0% | +45.6% | +9.1% | -2.5% | +1.8% | +10.7% | -3.0% | -19.1% | 2026-08-12 |
| 346 | DAL | Delta Air Lines | Industrials | Passenger Airlines | 54.9 | 68.6 | 9.1 | +21.5% | +46.1% | +46.9% | -10.5% | +10.3% | +11.2% | -10.9% | -48.0% | 2026-06-30 |
| 347 | COR | Cencora | Health Care | Health Care Distributors | 64.5 | 75.0 | 13.5 | +0.6% | +46.5% | +0.8% | -9.3% | -10.6% | +11.6% | -9.8% | -32.6% | 2025-11-25 |
| 348 | FOX | Fox Corporation (Class B) | Communication Services | Broadcasting | — incl. in FOXA | — incl. in FOXA | — incl. in FOXA | -12.9% | +46.9% | -3.2% | -16.6% | -24.1% | +12.0% | -17.4% | -34.5% | 2026-01-05 |
| 349 | WMB | Williams Companies | Energy | Oil & Gas Storage & Transportation | 87.1 | 123.7 | 17.6 | +21.0% | +47.3% | +26.8% | -9.0% | +9.8% | +12.4% | -10.3% | -14.4% | 2026-05-19 |
| 350 | PFG | Principal Financial Group | Financials | Life & Health Insurance | 24.0 | 23.4 | 8.5 | +31.1% | +47.4% | +38.9% | -4.8% | +19.9% | +12.5% | -4.8% | -21.9% | 2026-09-03 |
| 351 | DRI | Darden Restaurants | Consumer Discretionary | Restaurants | 25.2 | 33.3 | 15.5 | +24.9% | +48.4% | +27.6% | -1.3% | +13.7% | +13.5% | -2.1% | -25.1% | 2026-08-12 |
| 352 | ADM | Archer Daniels Midland | Consumer Staples | Agricultural Products & Services | 36.5 | 45.6 | 15.2 | +34.5% | +48.4% | +28.8% | -14.0% | +23.3% | +13.5% | -14.0% | -24.4% | 2026-09-17 |
| 353 | V | Visa Inc. | Financials | Transaction & Payment Processing Services | 795.3 | 753.1 | 23.7 | +22.1% | +48.6% | +25.9% | 0.0% | +10.9% | +13.7% | 0.0% | -20.8% | 2026-11-02 |
| 354 | CME | CME Group | Financials | Financial Exchanges & Data | 109.6 | 110.0 | 22.3 | +16.0% | +48.6% | +19.8% | -3.0% | +4.8% | +13.7% | -6.2% | -33.0% | 2026-03-02 |
| 355 | PH | Parker Hannifin | Industrials | Industrial Machinery & Supplies & Components | 117.1 | 121.7 | 21.5 | +6.3% | +48.9% | +21.1% | -13.4% | -4.9% | +14.0% | -13.6% | -27.1% | 2026-08-07 |
| 356 | ALL | Allstate | Financials | Property & Casualty Insurance | 66.8 | 69.5 | 4.1 | +28.7% | +49.0% | +40.5% | -3.6% | +17.5% | +14.1% | -4.0% | -19.4% | 2026-08-06 |
| 357 | TEL | TE Connectivity | Information Technology | Electronic Manufacturing Services | 62.5 | 65.3 | 12.6 | -3.4% | +49.0% | -11.0% | -11.7% | -14.6% | +14.1% | -12.7% | -22.3% | 2025-11-05 |
| 358 | LUV | Southwest Airlines | Industrials | Passenger Airlines | 21.5 | 24.0 | 8.9 | +7.8% | +49.5% | +47.7% | -18.7% | -3.4% | +14.6% | -19.8% | -33.8% | 2026-02-18 |
| 359 | CF | CF Industries | Materials | Fertilizers & Agricultural Chemicals | 18.2 | 23.0 | 5.9 | +57.9% | +49.6% | +47.5% | -13.6% | +46.7% | +14.7% | -13.6% | -29.6% | 2026-09-02 |
| 360 | NVDA | Nvidia | Information Technology | Semiconductors | 4879.1 | 4908.2 | 24.4 | +8.6% | +49.6% | +0.0% | -15.5% | -2.6% | +14.7% | -15.5% | -36.9% | 2026-10-06 |
| 361 | FDX | FedEx | Industrials | Air Freight & Logistics | 74.5 | 96.0 | 8.1 | +38.3% | +49.8%* | +58.2% | -5.8% | +27.1% | +14.9% | -6.2% | -35.1% | 2026-08-13 |
| 362 | NDAQ | Nasdaq, Inc. | Financials | Financial Exchanges & Data | 60.7 | 67.7 | 19.4 | +13.0% | +49.9% | +28.7% | 0.0% | +1.8% | +15.0% | 0.0% | -23.9% | 2026-11-02 |
| 363 | URI | United Rentals | Industrials | Trading Companies & Distributors | 72.8 | 88.2 | 17.5 | +46.1% | +50.6% | +36.0% | -1.9% | +34.9% | +15.7% | -1.9% | -37.3% | 2026-10-29 |
| 364 | LYV | Live Nation Entertainment | Communication Services | Movies & Entertainment | 41.3 | 45.4 | 29.3 | +24.3% | +51.2% | +18.5% | -6.0% | +13.1% | +16.3% | -6.0% | -27.8% | 2026-08-14 |
| 365 | ABBV | AbbVie | Health Care | Biotechnology | 510.4 | 585.5 | 18.5 | +30.2% | +51.3% | +36.4% | -2.0% | +19.0% | +16.4% | -2.0% | -21.5% | 2026-10-30 |
| 366 | EME | Emcor | Industrials | Construction & Engineering | 29.9 | 29.5 | 13.6 | +11.8% | +51.3% | +1.2% | -27.6% | +0.6% | +16.4% | -27.6% | -36.2% | 2026-05-06 |
| 367 | ILMN | Illumina, Inc. | Health Care | Life Sciences Tools & Services | 34.3 | 36.7 | 32.1 | +72.8% | +51.3% | +83.4% | -22.9% | +61.5% | +16.4% | -22.9% | -54.7% | 2026-10-05 |
| 368 | FOXA | Fox Corporation (Class A) | Communication Services | Broadcasting | 25.0 | 30.1 | 7.8 | -13.3% | +52.7% | -2.0% | -16.8% | -24.5% | +17.8% | -17.5% | -35.9% | 2026-01-06 |
| 369 | AAPL | Apple Inc. | Information Technology | Technology Hardware, Storage & Peripherals | 4937.5 | 5051.5 | 30.1 | +24.8% | +53.0% | +25.6% | -3.0% | +13.6% | +18.1% | -3.0% | -33.4% | 2026-10-29 |
| 370 | AMGN | Amgen | Health Care | Biotechnology | 251.6 | 295.3 | 17.1 | +45.1% | +54.9% | +60.3% | -0.1% | +33.9% | +20.0% | -0.1% | -20.5% | 2026-10-30 |
| 371 | HLT | Hilton Worldwide | Consumer Discretionary | Hotels, Resorts & Cruise Lines | 81.1 | 92.6 | 28.7 | +27.1% | +54.9% | +42.2% | 0.0% | +15.9% | +20.0% | 0.0% | -26.4% | 2026-11-02 |
| 372 | WAB | Wabtec | Industrials | Construction Machinery & Heavy Transportation Equipment | 48.4 | 53.2 | 19.2 | +34.8% | +55.0% | +40.9% | -6.1% | +23.6% | +20.1% | -6.2% | -23.6% | 2026-07-28 |
| 373 | MRK | Merck & Co. | Health Care | Pharmaceuticals | 366.0 | 415.7 | 26.0 | +43.9% | +55.5% | +77.6% | -4.6% | +32.7% | +20.5% | -5.2% | -29.2% | 2026-08-25 |
| 374 | TXN | Texas Instruments | Information Technology | Semiconductors | 276.1 | 280.3 | 26.2 | +77.9% | +55.5% | +91.1% | -8.2% | +66.7% | +20.6% | -9.1% | -33.9% | 2026-06-22 |
| 375 | KO | Coca-Cola Company (The) | Consumer Staples | Soft Drinks & Non-alcoholic Beverages | 412.3 | 432.8 | 24.8 | +39.7% | +55.9% | +42.8% | 0.0% | +28.5% | +21.0% | 0.0% | -11.1% | 2026-11-02 |
| 376 | GL | Globe Life | Financials | Life & Health Insurance | 12.3 | 15.2 | 9.2 | +15.2% | +56.2% | +22.5% | -13.9% | +4.0% | +21.3% | -14.1% | -16.8% | 2026-08-06 |
| 377 | CNP | CenterPoint Energy | Utilities | Multi-Utilities | 28.3 | 52.5 | 12.9 | +13.1% | +56.5% | +14.1% | -4.7% | +1.9% | +21.6% | -5.3% | -18.7% | 2026-06-26 |
| 378 | EVRG | Evergy | Utilities | Electric Utilities | 20.0 | 36.3 | 12.8 | +22.4% | +56.5% | +16.6% | -1.0% | +11.2% | +21.6% | -1.8% | -11.9% | 2026-07-02 |
| 379 | CVNA | Carvana | Consumer Discretionary | Automotive Retail | 51.8 | 52.7 | 19.7 | -14.7% | +57.1% | +17.4% | -24.8% | -25.9% | +22.2% | -24.8% | -43.0% | 2026-01-22 |
| 380 | INCY | Incyte | Health Care | Biotechnology | 24.5 | 20.7 | 10.2 | +21.5% | +57.7% | +28.4% | -7.6% | +10.3% | +22.8% | -7.6% | -33.8% | 2026-07-28 |
| 381 | CMI | Cummins | Industrials | Construction Machinery & Heavy Transportation Equipment | 68.9 | 74.3 | 14.8 | -0.9% | +57.8% | +16.1% | -30.9% | -12.1% | +22.9% | -31.2% | -31.3% | 2026-06-25 |
| 382 | EQT | EQT Corporation | Energy | Oil & Gas Exploration & Production | 34.3 | 43.7 | 6.4 | +3.2% | +57.8% | +3.6% | -18.8% | -8.0% | +22.9% | -19.3% | -28.5% | 2026-03-25 |
| 383 | EMR | Emerson Electric | Industrials | Electrical Components & Equipment | 92.6 | 103.6 | 17.1 | +26.5% | +58.0% | +20.8% | -2.8% | +15.3% | +23.1% | -2.8% | -29.9% | 2026-10-29 |
| 384 | WMT | Walmart | Consumer Staples | Consumer Staples Merchandise Retail | 1013.1 | 1050.0 | 23.8 | +15.3% | +58.2% | +27.3% | -4.6% | +4.1% | +23.3% | -4.8% | -23.5% | 2026-05-19 |
| 385 | JPM | JPMorgan Chase | Financials | Diversified Banks | 904.4 | 360.9 | — | +7.7% | +59.0% | +11.6% | -6.3% | -3.5% | +24.1% | -6.7% | -24.9% | 2026-08-12 |
| 386 | CSX | CSX Corporation | Industrials | Rail Transportation | 95.6 | 113.6 | 15.9 | +43.7% | +59.0% | +45.1% | -2.8% | +32.5% | +24.1% | -3.0% | -27.6% | 2026-07-24 |
| 387 | TKO | TKO Group Holdings | Communication Services | Movies & Entertainment | 13.5 | 22.5 | 13.9 | -10.3% | +59.4% | -0.2% | -16.7% | -21.5% | +24.4% | -17.7% | -23.9% | 2026-03-02 |
| 388 | AIZ | Assurant | Financials | Multi-line Insurance | 14.7 | 14.6 | 8.4 | +24.7% | +59.6% | +42.4% | -1.1% | +13.5% | +24.7% | -1.4% | -21.4% | 2026-08-05 |
| 389 | LH | Labcorp | Health Care | Health Care Services | 28.9 | 35.9 | 15.3 | +42.8% | +60.0% | +41.4% | -3.4% | +31.6% | +25.1% | -3.4% | -17.4% | 2026-10-29 |
| 390 | ETR | Entergy | Utilities | Electric Utilities | 52.5 | 82.5 | 14.9 | +21.0% | +60.2% | +17.2% | -5.8% | +9.8% | +25.2% | -6.8% | -16.8% | 2026-04-30 |
| 391 | FTNT | Fortinet | Information Technology | Systems Software | 92.7 | 95.7 | 34.8 | +58.9% | +60.2% | +46.0% | -35.2% | +47.7% | +25.2% | -35.2% | -35.2% | 2026-10-09 |
| 392 | IDXX | Idexx Laboratories | Health Care | Health Care Equipment | 52.9 | 44.3 | 27.3 | -0.7% | +61.0% | +6.7% | -12.4% | -11.9% | +26.1% | -12.4% | -34.2% | 2025-11-25 |
| 393 | CVX | Chevron Corporation | Energy | Integrated Oil & Gas | 444.4 | 493.7 | 8.5 | +53.6% | +61.7% | +50.1% | -3.3% | +42.4% | +26.8% | -3.3% | -21.5% | 2026-10-30 |
| 394 | HUM | Humana | Health Care | Managed Health Care | 49.3 | 40.7 | 11.3 | +61.8% | +61.7% | +49.5% | -5.1% | +50.6% | +26.8% | -5.3% | -47.5% | 2026-10-12 |
| 395 | GOOG | Alphabet Inc. (Class C) | Communication Services | Interactive Media & Services | — incl. in GOOGL | — incl. in GOOGL | — incl. in GOOGL | -11.2% | +62.2% | -1.1% | -30.2% | -22.4% | +27.3% | -30.3% | -30.3% | 2026-05-13 |
| 396 | TSLA | Tesla, Inc. | Consumer Discretionary | Automobile Manufacturers | 1596.2 | 1552.0 | 157.8 | -10.2% | +62.2% | -11.6% | -17.6% | -21.4% | +27.3% | -17.6% | -53.8% | 2025-12-16 |
| 397 | EL | Estée Lauder Companies (The) | Consumer Staples | Personal Care Products | 38.0 | 45.3 | 18.4 | +1.1% | +62.6% | +9.9% | -11.5% | -10.1% | +27.7% | -12.4% | -43.8% | 2026-02-04 |
| 398 | MAR | Marriott International | Consumer Discretionary | Hotels, Resorts & Cruise Lines | 108.6 | 121.4 | 25.2 | +35.0% | +62.6% | +61.1% | 0.0% | +23.8% | +27.7% | 0.0% | -30.7% | 2026-11-02 |
| 399 | RCL | Royal Caribbean Group | Consumer Discretionary | Hotels, Resorts & Cruise Lines | 85.9 | 104.7 | 14.6 | +17.0% | +64.0% | +14.2% | -10.2% | +5.8% | +29.1% | -12.2% | -37.0% | 2025-08-28 |
| 400 | GOOGL | Alphabet Inc. (Class A) | Communication Services | Interactive Media & Services | 3424.6 | 3343.6 | 18.0 | -10.7% | +64.0% | -0.5% | -30.6% | -21.9% | +29.1% | -30.7% | -30.7% | 2026-05-13 |
| 401 | MO | Altria | Consumer Staples | Tobacco | 128.4 | 151.2 | 11.8 | +40.3% | +64.1% | +46.1% | -1.1% | +29.1% | +29.2% | -1.1% | -19.1% | 2026-10-30 |
| 402 | NTAP | NetApp | Information Technology | Technology Hardware, Storage & Peripherals | 36.4 | 38.1 | 18.2 | +75.7% | +65.3% | +59.7% | -22.5% | +64.5% | +30.4% | -22.5% | -42.0% | 2026-10-12 |
| 403 | CAT | Caterpillar Inc. | Industrials | Construction Machinery & Heavy Transportation Equipment | 282.1 | 324.0 | 18.8 | +8.0% | +65.5% | +7.2% | -42.1% | -3.2% | +30.6% | -42.4% | -42.4% | 2026-06-30 |
| 404 | CFG | Citizens Financial Group | Financials | Regional Banks | 27.2 | 33.2 | — | +14.4% | +65.9% | +31.3% | -12.4% | +3.2% | +31.0% | -13.1% | -29.3% | 2026-08-14 |
| 405 | MPWR | Monolithic Power Systems | Information Technology | Semiconductors | 60.7 | 58.0 | 49.7 | +37.9% | +66.3% | +24.6% | -26.2% | +26.7% | +31.4% | -26.4% | -42.0% | 2026-06-03 |
| 406 | ANET | Arista Networks | Information Technology | Communications Equipment | 207.0 | 199.6 | 43.0 | +25.3% | +66.6% | +4.1% | -24.3% | +14.1% | +31.7% | -24.3% | -50.4% | 2026-10-09 |
| 407 | XOM | ExxonMobil | Energy | Integrated Oil & Gas | 732.9 | 792.6 | 10.0 | +52.3% | +66.7% | +61.7% | -4.0% | +41.1% | +31.7% | -4.0% | -20.6% | 2026-10-30 |
| 408 | MS | Morgan Stanley | Financials | Investment Banking & Brokerage | 290.7 | 167.7 | — | +7.0% | +67.1% | +15.8% | -17.8% | -4.2% | +32.2% | -18.7% | -29.2% | 2026-07-15 |
| 409 | DGX | Quest Diagnostics | Health Care | Health Care Services | 27.7 | 33.7 | 14.3 | +47.0% | +67.3% | +44.9% | -0.8% | +35.8% | +32.4% | -0.8% | -11.9% | 2026-10-29 |
| 410 | TRV | Travelers Companies (The) | Financials | Property & Casualty Insurance | 81.7 | 84.8 | 7.4 | +39.0% | +67.6% | +50.7% | -1.6% | +27.8% | +32.7% | -1.6% | -12.8% | 2026-10-22 |
| 411 | ROST | Ross Stores | Consumer Discretionary | Apparel Retail | 73.7 | 73.4 | 20.1 | +28.8% | +67.9% | +46.3% | -9.5% | +17.6% | +33.0% | -9.7% | -21.3% | 2026-08-07 |
| 412 | HST | Host Hotels & Resorts | Real Estate | Hotel & Resort REITs | 17.5 | 21.3 | 12.5 | +52.7% | +68.4% | +72.3% | -0.5% | +41.5% | +33.5% | -0.5% | -33.4% | 2026-10-29 |
| 413 | IVZ | Invesco | Financials | Asset Management & Custody Banks | 12.2 | 13.5 | 8.6 | +8.1% | +68.8% | +20.9% | -16.6% | -3.1% | +33.9% | -16.6% | -37.2% | 2026-08-27 |
| 414 | ULTA | Ulta Beauty | Consumer Discretionary | Other Specialty Retail | 27.4 | 29.7 | 15.4 | +5.4% | +68.8% | +22.6% | -9.8% | -5.8% | +33.9% | -9.8% | -36.2% | 2026-02-17 |
| 415 | ROK | Rockwell Automation | Industrials | Electrical Components & Equipment | 48.9 | 51.6 | 24.7 | +14.2% | +68.9% | +21.1% | -10.8% | +3.0% | +34.0% | -11.1% | -27.9% | 2026-06-30 |
| 416 | CBOE | Cboe Global Markets | Financials | Financial Exchanges & Data | 36.4 | 33.9 | 16.7 | +40.2% | +69.0% | +43.2% | -4.3% | +29.0% | +34.1% | -4.8% | -36.9% | 2026-05-13 |
| 417 | CVS | CVS Health | Health Care | Health Care Services | 113.2 | 178.0 | 10.7 | +14.9% | +70.5% | +16.7% | -18.9% | +3.8% | +35.5% | -20.0% | -28.9% | 2026-07-21 |
| 418 | BEN | Franklin Resources | Financials | Asset Management & Custody Banks | 16.2 | 19.6 | 10.9 | +38.5% | +70.9% | +48.4% | -9.7% | +27.3% | +36.0% | -10.6% | -26.8% | 2026-08-04 |
| 419 | DE | Deere & Company | Industrials | Agricultural & Farm Machinery | 180.0 | 239.8 | 27.9 | +44.5% | +71.0% | +46.3% | -5.7% | +33.3% | +36.1% | -5.9% | -20.1% | 2026-09-23 |
| 420 | PM | Philip Morris International | Consumer Staples | Tobacco | 324.6 | 368.5 | 18.3 | +33.2% | +71.2% | +49.4% | -0.2% | +22.0% | +36.3% | -0.2% | -22.0% | 2026-10-30 |
| 421 | CASY | Casey's | Consumer Staples | Food Retail | 24.7 | 27.5 | 17.6 | +21.3% | +71.3% | +30.6% | -26.9% | +10.1% | +36.4% | -27.1% | -36.2% | 2026-06-11 |
| 422 | EXPD | Expeditors International | Industrials | Air Freight & Logistics | 26.1 | 25.4 | 20.1 | +35.3% | +72.4% | +66.2% | 0.0% | +24.1% | +37.5% | 0.0% | -18.7% | 2026-11-02 |
| 423 | HII | Huntington Ingalls Industries | Industrials | Aerospace & Defense | 12.4 | 15.0 | 12.1 | -6.6% | +72.9% | -1.0% | -30.2% | -17.8% | +38.0% | -30.9% | -43.4% | 2026-03-02 |
| 424 | DG | Dollar General | Consumer Staples | Consumer Staples Merchandise Retail | 30.0 | 43.4 | 12.1 | +4.2% | +73.6% | +40.3% | -11.8% | -7.0% | +38.7% | -13.1% | -34.9% | 2026-02-27 |
| 425 | VTRS | Viatris | Health Care | Pharmaceuticals | 21.4 | 34.0 | 7.9 | +53.5% | +74.4% | +86.6% | -2.8% | +42.3% | +39.5% | -2.8% | -45.7% | 2026-10-29 |
| 426 | LLY | Lilly (Eli) | Health Care | Pharmaceuticals | 1256.8 | 1307.3 | 28.1 | +31.9% | +74.7% | +64.6% | -0.5% | +20.7% | +39.8% | -0.5% | -32.7% | 2026-10-30 |
| 427 | DDOG | Datadog | Information Technology | Application Software | 77.6 | 80.8 | 974.4 | +58.9% | +75.3% | +32.7% | -26.3% | +47.7% | +40.4% | -26.3% | -48.6% | 2026-10-09 |
| 428 | RTX | RTX Corporation | Industrials | Aerospace & Defense | 273.7 | 301.1 | 17.8 | +11.8% | +76.8% | +15.3% | -10.1% | +0.6% | +41.9% | -10.1% | -20.1% | 2026-08-18 |
| 429 | VRSN | Verisign | Information Technology | Internet Services & Infrastructure | 27.7 | 28.9 | 24.0 | +28.1% | +77.7% | +30.2% | -0.2% | +16.9% | +42.8% | -0.5% | -30.9% | 2026-05-22 |
| 430 | JNJ | Johnson & Johnson | Health Care | Pharmaceuticals | 651.3 | 685.1 | 19.9 | +32.8% | +78.4% | +46.5% | -2.8% | +21.6% | +43.5% | -2.8% | -12.7% | 2026-09-03 |
| 431 | NTRS | Northern Trust | Financials | Asset Management & Custody Banks | 30.9 | 39.5 | — | +26.8% | +79.3% | +35.4% | -10.4% | +15.6% | +44.4% | -10.9% | -25.8% | 2026-08-17 |
| 432 | GM | General Motors | Consumer Discretionary | Automobile Manufacturers | 76.4 | 178.3 | 9.5 | +11.3% | +79.9% | +31.3% | -0.2% | +0.1% | +45.0% | -0.4% | -29.4% | 2026-07-28 |
| 433 | GS | Goldman Sachs | Financials | Investment Banking & Brokerage | 261.7 | 109.7 | — | +3.7% | +80.0% | +16.1% | -21.6% | -7.5% | +45.1% | -22.0% | -31.2% | 2026-07-15 |
| 434 | MNST | Monster Beverage | Consumer Staples | Soft Drinks & Non-alcoholic Beverages | 94.1 | 89.4 | 30.5 | +25.3% | +83.6% | +43.7% | -3.9% | +14.1% | +48.7% | -3.9% | -18.1% | 2026-07-16 |
| 435 | WELL | Welltower | Real Estate | Health Care REITs | 175.3 | 192.3 | 52.0 | +30.1% | +85.4% | +34.0% | -4.8% | +18.9% | +50.5% | -5.2% | -13.0% | 2026-07-24 |
| 436 | TRGP | Targa Resources | Energy | Oil & Gas Storage & Transportation | 63.2 | 87.1 | 15.8 | +62.8% | +85.7% | +94.9% | -6.4% | +51.5% | +50.8% | -6.4% | -32.6% | 2026-10-30 |
| 437 | GE | GE Aerospace | Industrials | Aerospace & Defense | 327.6 | 322.9 | 27.8 | +3.0% | +86.0% | +2.8% | -17.0% | -8.2% | +51.1% | -17.2% | -25.1% | 2026-08-05 |
| 438 | CRL | Charles River Laboratories | Health Care | Life Sciences Tools & Services | 16.2 | 20.0 | 23.6 | +69.7% | +87.1% | +88.0% | -10.0% | +58.5% | +52.2% | -10.0% | -54.8% | 2026-10-29 |
| 439 | ADI | Analog Devices | Information Technology | Semiconductors | 200.1 | 209.0 | 30.2 | +53.6% | +88.6% | +78.5% | -7.0% | +42.4% | +53.7% | -7.3% | -32.5% | 2026-06-22 |
| 440 | EXPE | Expedia Group | Consumer Discretionary | Hotels, Resorts & Cruise Lines | 35.9 | 34.1 | 11.8 | +6.1% | +90.2% | +36.9% | -11.7% | -5.1% | +55.3% | -11.8% | -37.4% | 2026-08-24 |
| 441 | MCK | McKesson | Health Care | Health Care Distributors | 116.4 | 125.5 | 17.8 | +22.1% | +91.3% | +23.5% | -3.1% | +10.9% | +56.4% | -3.1% | -27.2% | 2026-10-20 |
| 442 | CSCO | Cisco | Information Technology | Communications Equipment | 400.6 | 427.3 | 22.9 | +34.4% | +91.3% | +41.6% | -21.2% | +23.2% | +56.4% | -21.8% | -21.8% | 2026-06-04 |
| 443 | STT | State Street Corporation | Financials | Asset Management & Custody Banks | 46.1 | -58.0 | — | +34.4% | +92.6% | +49.9% | -12.4% | +23.2% | +57.7% | -12.8% | -26.3% | 2026-09-04 |
| 444 | HAS | Hasbro | Consumer Discretionary | Leisure Products | 16.6 | 19.1 | 12.3 | +47.6% | +93.5% | +60.1% | -1.0% | +36.4% | +58.5% | -1.0% | -28.4% | 2026-10-29 |
| 445 | STLD | Steel Dynamics | Materials | Steel | 35.8 | 39.1 | 12.2 | +49.8% | +93.5% | +62.4% | -10.5% | +38.6% | +58.6% | -10.9% | -29.2% | 2026-06-12 |
| 446 | PANW | Palo Alto Networks | Information Technology | Systems Software | 287.9 | 298.8 | 191.5 | +90.9% | +94.0% | +59.7% | -16.2% | +79.7% | +59.1% | -16.2% | -36.0% | 2026-10-06 |
| 447 | AVGO | Broadcom | Information Technology | Semiconductors | 1538.2 | 1592.0 | 30.5 | -6.4% | +94.1% | -12.2% | -32.9% | -17.6% | +59.2% | -33.1% | -41.5% | 2026-06-02 |
| 448 | IBKR | Interactive Brokers | Financials | Investment Banking & Brokerage | 33.9 | -42.9 | -4.3 | +16.7% | +96.5% | +6.8% | -23.7% | +5.5% | +61.6% | -23.8% | -38.7% | 2026-08-25 |
| 449 | KEYS | Keysight Technologies | Information Technology | Electronic Equipment & Instruments | 50.9 | 52.5 | 30.9 | +47.1% | +97.3% | +63.4% | -23.0% | +35.9% | +62.4% | -23.0% | -31.4% | 2026-10-06 |
| 450 | JCI | Johnson Controls | Industrials | Building Products | 88.7 | 98.7 | 21.2 | +23.4% | +98.2% | +29.2% | -7.7% | +12.2% | +63.3% | -7.7% | -21.5% | 2026-10-06 |
| 451 | NUE | Nucor | Materials | Steel | 63.0 | 66.7 | 10.0 | +71.6% | +99.1% | +87.2% | 0.0% | +60.4% | +64.2% | 0.0% | -38.5% | 2026-11-02 |
| 452 | GILD | Gilead Sciences | Health Care | Biotechnology | 211.3 | 229.9 | 15.7 | +41.3% | +100.8% | +45.7% | -0.2% | +30.1% | +65.9% | -0.2% | -22.0% | 2026-10-30 |
| 453 | WSM | Williams-Sonoma, Inc. | Consumer Discretionary | Homefurnishing Retail | 30.6 | 30.3 | 18.2 | +47.2% | +101.9% | +35.3% | -0.5% | +36.0% | +67.0% | -0.5% | -36.8% | 2026-10-22 |
| 454 | MRVL | Marvell Technology | Information Technology | Semiconductors | 154.0 | 173.6 | 60.9 | +102.0% | +103.2% | +83.2% | -45.8% | +90.8% | +68.3% | -45.8% | -60.8% | 2026-06-04 |
| 455 | C | Citigroup | Financials | Diversified Banks | 203.8 | -360.4 | — | +7.1% | +103.4% | +24.2% | -15.1% | -4.1% | +68.5% | -15.5% | -31.3% | 2026-06-22 |
| 456 | BNY | BNY Mellon | Financials | Asset Management & Custody Banks | 99.4 | 0.6 | — | +29.6% | +104.1% | +39.4% | -10.0% | +18.4% | +69.2% | -10.3% | -17.6% | 2026-09-04 |
| 457 | PWR | Quanta Services | Industrials | Construction & Engineering | 93.6 | 98.8 | 27.1 | +47.3% | +105.1% | +38.4% | -20.9% | +36.1% | +70.2% | -20.9% | -33.9% | 2026-05-06 |
| 458 | RL | Ralph Lauren Corporation | Consumer Discretionary | Apparel, Accessories & Luxury Goods | 23.7 | 24.5 | 15.4 | +13.3% | +106.0% | +25.7% | -3.5% | +2.1% | +71.1% | -4.0% | -36.4% | 2026-06-24 |
| 459 | AMAT | Applied Materials | Information Technology | Semiconductor Materials & Equipment | 297.2 | 307.7 | 30.3 | +46.3% | +107.5% | +61.6% | -48.1% | +35.1% | +72.6% | -48.2% | -48.2% | 2026-06-30 |
| 460 | DLTR | Dollar Tree | Consumer Staples | Consumer Staples Merchandise Retail | 26.0 | 31.7 | 12.7 | +12.7% | +108.1% | +39.8% | -1.9% | +1.5% | +73.2% | -1.9% | -38.5% | 2026-01-15 |
| 461 | JBL | Jabil | Information Technology | Electronic Manufacturing Services | 27.4 | 30.7 | 12.2 | +16.9% | +109.3% | +20.7% | -30.9% | +5.7% | +74.4% | -30.9% | -32.6% | 2026-06-15 |
| 462 | VRT | Vertiv | Industrials | Electrical Components & Equipment | 86.3 | 89.2 | 28.0 | +38.5% | +110.3% | +16.4% | -40.4% | +27.3% | +75.4% | -40.4% | -61.3% | 2026-05-14 |
| 463 | HWM | Howmet Aerospace | Industrials | Aerospace & Defense | 84.7 | 83.3 | 27.3 | +4.0% | +114.0% | +3.6% | -27.2% | -7.2% | +79.1% | -27.2% | -36.5% | 2026-08-18 |
| 464 | EBAY | eBay Inc. | Consumer Discretionary | Broadline Retail | 53.1 | 58.6 | 18.4 | +40.1% | +114.1% | +50.6% | -1.6% | +28.9% | +79.2% | -1.6% | -21.2% | 2026-10-15 |
| 465 | COHR | Coherent Corp. | Information Technology | Electronic Components | 39.4 | 43.1 | 30.3 | +8.3% | +116.7% | +51.5% | -53.2% | -2.9% | +81.8% | -53.2% | -54.9% | 2026-06-02 |
| 466 | P | Everpure | Information Technology | Technology Hardware, Storage & Peripherals | 37.9 | 41.5 | 108.1 | +69.8% | +123.3% | +15.3% | -27.5% | +58.6% | +88.4% | -27.5% | -48.6% | 2026-10-13 |
| 467 | CAH | Cardinal Health | Health Care | Health Care Distributors | 58.9 | 63.6 | 15.0 | +24.9% | +124.2% | +34.6% | -1.2% | +13.7% | +89.3% | -1.2% | -20.6% | 2026-10-20 |
| 468 | APA | APA Corporation | Energy | Oil & Gas Exploration & Production | 17.1 | 22.9 | 4.0 | +105.3% | +129.0% | +121.7% | -7.6% | +94.1% | +94.1% | -7.6% | -44.9% | 2026-10-30 |
| 469 | KLAC | KLA Corporation | Information Technology | Semiconductor Materials & Equipment | 199.5 | 207.0 | 31.5 | +26.5% | +132.2% | +27.4% | -49.2% | +15.3% | +97.3% | -49.2% | -51.7% | 2026-06-30 |
| 470 | FLEX | Flex Ltd. | Information Technology | Electronic Manufacturing Services | 31.1 | 34.9 | 15.6 | +39.4% | +137.3% | +34.7% | -48.0% | +28.2% | +102.4% | -48.0% | -52.8% | 2026-06-30 |
| 471 | APH | Amphenol | Information Technology | Electronic Components | 197.1 | 208.5 | 19.1 | +18.8% | +138.8% | +15.4% | -9.9% | +7.6% | +103.9% | -9.9% | -28.3% | 2026-10-06 |
| 472 | TWLO | Twilio | Information Technology | Systems Software | 32.1 | 29.9 | 50.9 | +46.0% | +144.7% | +53.9% | -31.1% | +34.8% | +109.8% | -31.1% | -45.2% | 2026-10-01 |
| 473 | PSX | Phillips 66 | Energy | Oil & Gas Refining & Marketing | 107.3 | 124.2 | 8.1 | +117.6% | +144.9% | +108.0% | -7.5% | +106.4% | +110.0% | -7.5% | -31.9% | 2026-10-14 |
| 474 | TER | Teradyne | Information Technology | Semiconductor Materials & Equipment | 40.8 | 42.6 | 24.1 | +35.0% | +146.7% | +43.9% | -46.0% | +23.8% | +111.8% | -46.0% | -51.5% | 2026-06-30 |
| 475 | NEM | Newmont | Materials | Gold | 113.4 | 107.7 | 6.1 | +10.0% | +148.2% | +36.0% | -19.1% | -1.2% | +113.3% | -19.3% | -32.4% | 2026-08-25 |
| 476 | INTC | Intel | Information Technology | Semiconductors | 318.7 | 362.3 | 18.9 | +62.5% | +158.5% | +50.0% | -57.5% | +51.3% | +123.6% | -57.5% | -57.5% | 2026-06-22 |
| 477 | GLW | Corning Inc. | Information Technology | Electronic Components | 106.1 | 113.5 | 25.4 | +41.5% | +162.5% | +39.5% | -51.7% | +30.3% | +127.6% | -51.8% | -51.8% | 2026-06-29 |
| 478 | TPR | Tapestry, Inc. | Consumer Discretionary | Apparel, Accessories & Luxury Goods | 24.0 | 26.0 | 12.8 | -4.6% | +165.2% | +11.4% | -26.4% | -15.8% | +130.2% | -26.7% | -33.0% | 2026-08-10 |
| 479 | HPE | Hewlett Packard Enterprise | Information Technology | Technology Hardware, Storage & Peripherals | 68.0 | 87.3 | 12.7 | +115.7% | +166.8% | +113.4% | -30.3% | +104.5% | +131.9% | -30.3% | -48.8% | 2026-10-09 |
| 480 | GEV | GE Vernova | Industrials | Heavy Electrical Equipment | 228.2 | 215.6 | 42.7 | +32.2% | +187.8% | +47.7% | -26.6% | +21.1% | +152.8% | -26.6% | -38.3% | 2026-06-30 |
| 481 | FIX | Comfort Systems USA | Industrials | Construction & Engineering | 42.2 | 41.2 | 18.1 | +28.8% | +207.7% | +24.6% | -41.9% | +17.6% | +172.8% | -41.9% | -46.1% | 2026-06-22 |
| 482 | DELL | Dell Technologies | Information Technology | Technology Hardware, Storage & Peripherals | 249.7 | 293.5 | 16.6 | +215.3% | +208.8% | +145.0% | -33.1% | +204.1% | +173.9% | -33.2% | -50.3% | 2026-09-17 |
| 483 | LRCX | Lam Research | Information Technology | Semiconductor Materials & Equipment | 284.8 | 295.0 | 29.2 | +33.3% | +208.9% | +45.2% | -47.4% | +22.1% | +174.0% | -47.5% | -47.5% | 2026-06-30 |
| 484 | MPC | Marathon Petroleum | Energy | Oil & Gas Refining & Marketing | 120.9 | 158.1 | 10.3 | +167.7% | +212.7% | +124.5% | -11.2% | +156.5% | +177.8% | -11.2% | -25.9% | 2026-10-14 |
| 485 | VLO | Valero Energy | Energy | Oil & Gas Refining & Marketing | 106.4 | 115.7 | 5.6 | +137.8% | +213.8% | +129.7% | -17.0% | +126.6% | +178.9% | -17.0% | -27.3% | 2026-10-14 |
| 486 | CRWD | CrowdStrike | Information Technology | Systems Software | 247.6 | 252.3 | 2360.7 | +106.3% | +219.1% | +78.1% | -13.3% | +95.1% | +184.2% | -13.3% | -37.2% | 2026-10-06 |
| 487 | AMD | Advanced Micro Devices | Information Technology | Semiconductors | 762.1 | 815.2 | 85.3 | +118.0% | +229.1% | +82.3% | -28.1% | +106.8% | +194.2% | -28.1% | -47.8% | 2026-10-06 |
| 488 | HOOD | Robinhood Markets | Financials | Investment Banking & Brokerage | 75.5 | 74.3 | 30.8 | -25.9% | +249.8% | -42.9% | -45.0% | -37.1% | +214.9% | -45.0% | -57.3% | 2025-10-09 |
| 489 | ECHO | EchoStar | Communication Services | Wireless Telecommunication Services | 28.6 | 45.3 | 22.8 | -9.6% | +298.0% | +31.2% | -30.7% | -20.8% | +263.1% | -30.7% | -48.8% | 2026-05-20 |
| 490 | MRNA | Moderna | Health Care | Biotechnology | 88.2 | 84.7 | -38.6 | +648.8% | +304.2% | +713.1% | -10.2% | +637.6% | +269.3% | -10.2% | -58.2% | 2026-10-21 |
| 491 | PLTR | Palantir Technologies | Information Technology | Application Software | 428.6 | 433.3 | 162.7 | +0.3% | +325.4% | -11.0% | -14.7% | -10.9% | +290.5% | -14.7% | -48.2% | 2026-10-09 |
| 492 | CIEN | Ciena | Information Technology | Communications Equipment | 40.3 | 46.1 | 45.0 | +21.6% | +344.5% | +49.7% | -54.6% | +10.4% | +309.6% | -54.6% | -54.6% | 2026-06-02 |
| 493 | STX | Seagate Technology | Information Technology | Technology Hardware, Storage & Peripherals | 136.3 | 149.4 | 25.5 | +116.3% | +517.3% | +133.4% | -45.6% | +105.1% | +482.4% | -45.7% | -45.7% | 2026-06-22 |
| 494 | WDC | Western Digital | Information Technology | Technology Hardware, Storage & Peripherals | 126.7 | 136.7 | 21.6 | +96.8% | +583.3%* | +125.8% | -54.6% | +85.5% | +548.4% | -54.6% | -55.5% | 2026-06-18 |
| 495 | MU | Micron Technology | Information Technology | Semiconductors | 943.1 | 962.8 | 8.8 | +192.3% | +740.3% | +272.9% | -31.3% | +181.1% | +705.4% | -31.3% | -42.9% | 2026-06-25 |
| 496 | LITE | Lumentum | Information Technology | Communications Equipment | 62.0 | 74.3 | 92.8 | +85.7% | +947.3% | +239.6% | -39.6% | +74.5% | +912.4% | -39.6% | -50.6% | 2026-10-06 |
| 497 | BE | Bloom Energy | Industrials | Electrical Components & Equipment | 58.0 | 60.4 | 100.2 | +125.9% | +1874.3% | +48.5% | -43.3% | +114.7% | +1839.4% | -43.3% | -52.6% | 2026-06-22 |
| 498 | SNDK | Sandisk | Information Technology | Technology Hardware, Storage & Peripherals | 153.0 | 158.8 | 7.5 | +352.9% | — | +439.4% | -54.0% | +341.7% | — | -54.0% | -56.5% | 2026-06-25 |
| 499 | HONA | Honeywell Aerospace | Industrials | Aerospace & Defense | 50.1 | 63.6 | 14.9 | — | — | — | -41.5% | — | — | -41.5% | -43.9% | 2026-06-16 |
| 500 | Q | Qnity Electronics | Information Technology | Semiconductor Materials & Equipment | 24.1 | 28.3 | 18.5 | +41.5% | — | +21.8% | -34.3% | +30.3% | — | -34.3% | -38.1% | 2026-06-22 |
| 501 | FDXF | FedEx Freight | Industrials | Cargo Ground Transportation | 19.7 | 24.7 | 25.0 | — | — | — | -30.0% | — | — | -30.0% | -42.7% | 2026-06-09 |
| 502 | DVA | DaVita | Health Care | Health Care Services | 11.7 | 26.3 | 9.3 | — | — | — | — | — | — | — | — | — |
| 503 | VYLR | Vylor | Consumer Staples | Agricultural Products & Services | 49.1 | 51.1 | 11.9 | — | — | — | — | — | — | — | — | — |
Names now ≤ −35% by sector
NOW = close as of 2 Nov 2026. ≤ −35% = price vs 24m high (Close ÷ peak Close − 1), not total return. Sectors = GICS Sector (11 groups).
| Sector | Count |
|---|---|
| Information Technology | 29 |
| Industrials | 13 |
| Consumer Discretionary | 12 |
| Financials | 9 |
| Sector | Count |
|---|---|
| Communication Services | 7 |
| Health Care | 6 |
| Consumer Staples | 5 |
| Utilities | 4 |
| Sector | Count |
|---|---|
| Materials | 3 |
| Real Estate | 2 |
| Energy | 1 |
Column definitions
- Market Cap (USD bn) — Equity market capitalization from yfinance, in USD billions. Multi-class issuers show one company total on the Class A row.
- EV (USD bn) — Enterprise Value = yfinance
enterpriseValue(market cap + total debt − cash & cash equivalents; preferred / minority interest when included in the feed). - EV/EBITDA TTM multiple — EV ÷ trailing-twelve-month EBITDA. Primary: Yahoo Finance info
enterpriseValue÷ebitda. Secondary (when primary EBITDA is missing): Yahoo quarterly income statement — sum of last 4 reported quarters' EBITDA (else EBIT / Operating Income + Reconciled Depreciation). When EBITDA is negative, the multiple is negative and shown in red. Blank — only if EV or EBITDA is missing (banks/financials often have no EBITDA line); not blank for negative EBITDA. - YTD / 12m / 24m TR — Total return including dividends (Adj Close) over year-to-date, ~12 months, and ~24 months.
- vs S&P YTD / 24m — Stock TR minus S&P 500 index TR over the same window (positive = beat the index).
- Price drawdown vs peak / Max drawdown (24m) — Price-only (Close): how far the latest close sits below the ~24m high; largest peak-to-trough fall in that window.